
Vendor Risk in Business Terms | SAFE
Reduce Third-Party Breach Exposure

Vendor risk scores
leadership cannot act on

Third-party risk usually reaches leadership as findings, severity levels and abstract scores. None of them says what a vendor failure would cost or which exposure to fix first. SAFE TPRM expresses vendor risk in financial and operational terms, with the drivers behind every change.

The Problem

What vendor risk reporting looks like today

  1. Risk is reported as scores

    Third-party risk reaches leadership as findings, severity levels and abstract ratings.

  2. Business leaders cannot read it

    Technical measures do not translate into exposure a business stakeholder can weigh.

  3. Vendors are hard to compare

    There is no common way to rank vendors by the impact they could have.

  4. Cost is left out

    Technical exposure is rarely tied to its financial or operational consequences.

Exposure Score and Business Impact on SAFE TPRM

From abstract scores to business exposure

When risk is reported as technical scores

  • Executives cannot confidently rank competing third-party risks.
  • Leaders accept exposure without understanding the consequences.
  • Security teams struggle to justify remediation spend.
  • High technical severity gets mistaken for high business impact, and the reverse.

When risk is reported in business terms

  • Resources go to the exposures with the greatest potential business impact.
  • Executives understand the consequences before they accept a risk.
  • Investment decisions reflect the expected reduction in financial exposure.
  • Third-party cyber risk informs broader business decisions.
How SAFE Helps

Vendor risk expressed in terms the business uses

Two capabilities translate technical findings into financial exposure and explain what drives it, so security and business leaders can rank vendors on the same scale.

Likelihood, loss magnitude, vendor criticality and operational impact come together in one view of each vendor's risk.

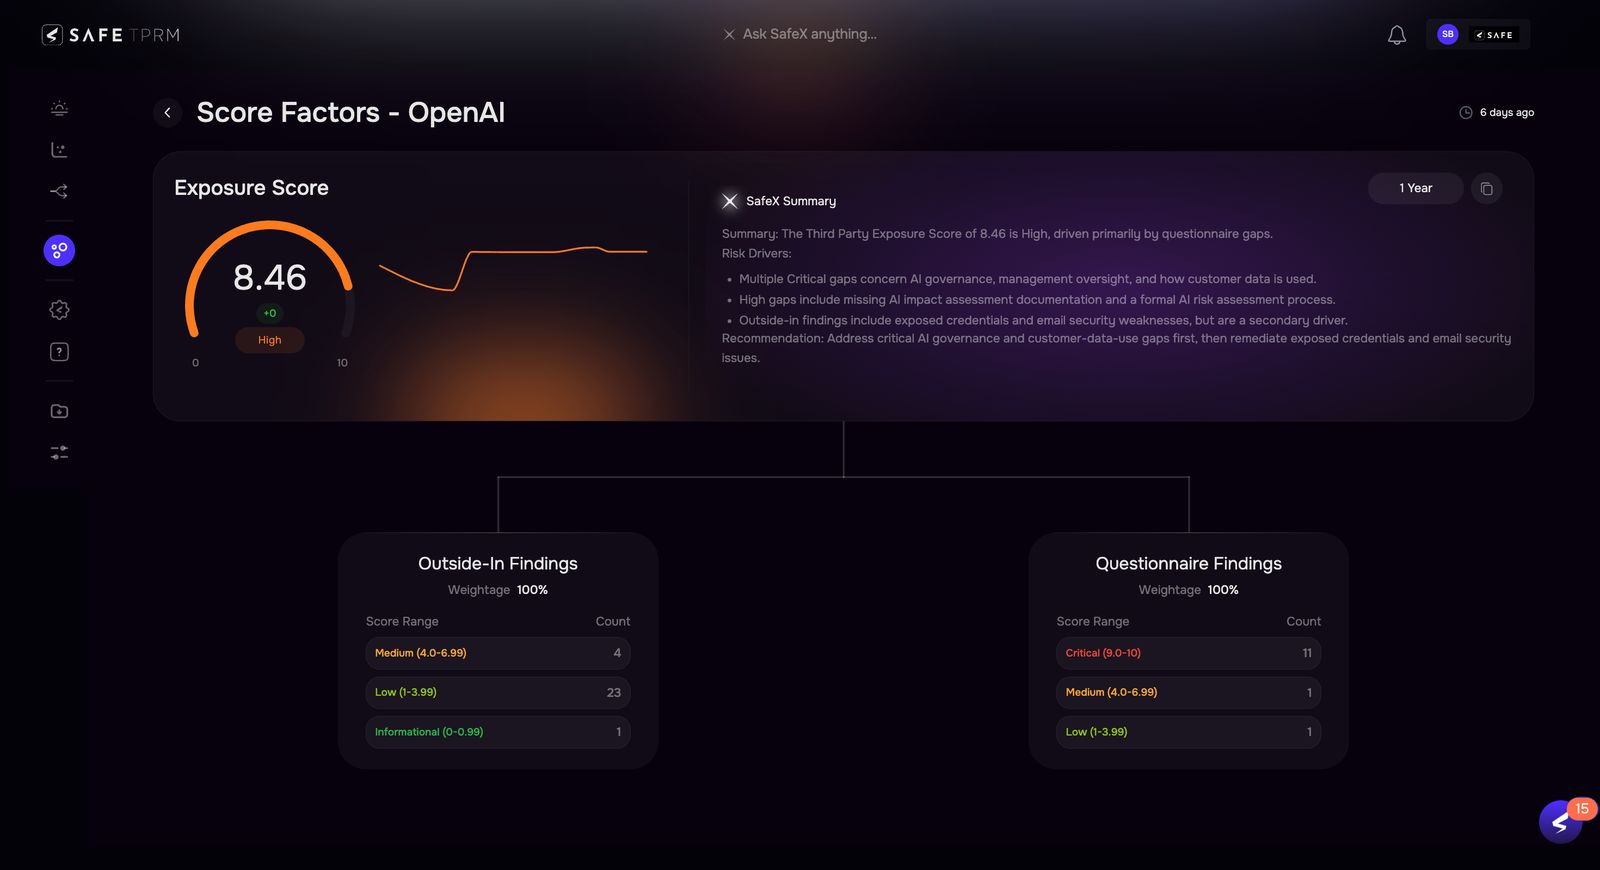
SAFE TPRM shows loss magnitude, annualized loss exposure and a exposure score

Quantify each vendor's risk in financial terms

SAFE calculates loss likelihood, loss magnitude and annualized loss exposure for every third party with a FAIR-based model, in your currency.

  • Compare vendors and prioritize mitigation by business impact.
  • Quantified exposure updates as findings, controls and threat conditions change.
  • Loss trends show how exposure changes over time, with drill-down into the drivers.
  • Portfolio-level loss rolls exposure up across vendors and groups.
  • Financial outputs are written back to ServiceNow, so quantified risk reaches workflows you already use.
Explore risk scoring and quantification
SAFE X in SAFE TPRM summarizes the most critical issues

Explain what drives each vendor's risk

AI identifies the findings, control gaps and external exposures that contribute most to each vendor's risk.

  • AI recommends priority controls and next steps, each linked to its evidence.
  • An AI narrative explains why a score changed.
  • For each material risk, SAFE recommends accept, remediate, reject or escalate under your policy.
  • Leaders and analysts keep approval of material decisions.
Explore AI risk decisioning
The Proof

Machine-Speed Defense. Measurable Results.

Instacart operationalizes enterprise-scale TPRM while reducing assessment effort.

Retail USA

Read the Full Story

The Challenge

Instacart's TPRM team managed hundreds of vendors through manual processes that slowed assessments and limited visibility. They needed a more automated, risk-based approach to scale the program.

The Results

30+
hours
of analyst work eliminated per assessment
3
weeks
to operationalize TPRM with 600+ vendors
100%
vendors
assessed and monitored with zero added headcount
Book a demo

Ready to meet your AI Co-Workers?

Get a Demo