So we added controls analytics, benchmark data and real-time data feeds to build the industry’s most scalable cyber risk management platform
By Nick Sanna
At SAFE, we are the world’s biggest boosters of FAIR (Factor Analysis of Information Risk), the standard model for quantifying cyber and operational risk in the financial terms that enable well-informed business decision making. Our company is the technical adviser to the FAIR Institute and FAIR is the driving engine of our cyber risk management platform, SAFE One.
But we would be the first to concede that using the FAIR model by itself has some serious limitations. Out of the box, it doesn’t scale to the level that enterprise risk management requires today – not on speed of delivering results or breadth of covering the threat landscape.
At a time when cyber defenders hope to fully automate cyber risk management, the original version of FAIR has another deficiency, as FAIR creator Jack Jones himself acknowledged in a blog post: “It hasn’t included a formulaic way to account for how controls affect risk” (more on that later).
Spreadsheets and ‘FAIR Fatigue’
We frequently hear from FAIR fans who bought the book “Measuring and Managing Information Risk: a FAIR Approach, fired up by the breakthrough concepts, the analytical rigor, and logical simplicity of the FAIR model, set out to run FAIR analysis on their own, armed with a homemade spreadsheet. True, you can use FAIR as a tool to think through risk assessment, even with a pen on a napkin.
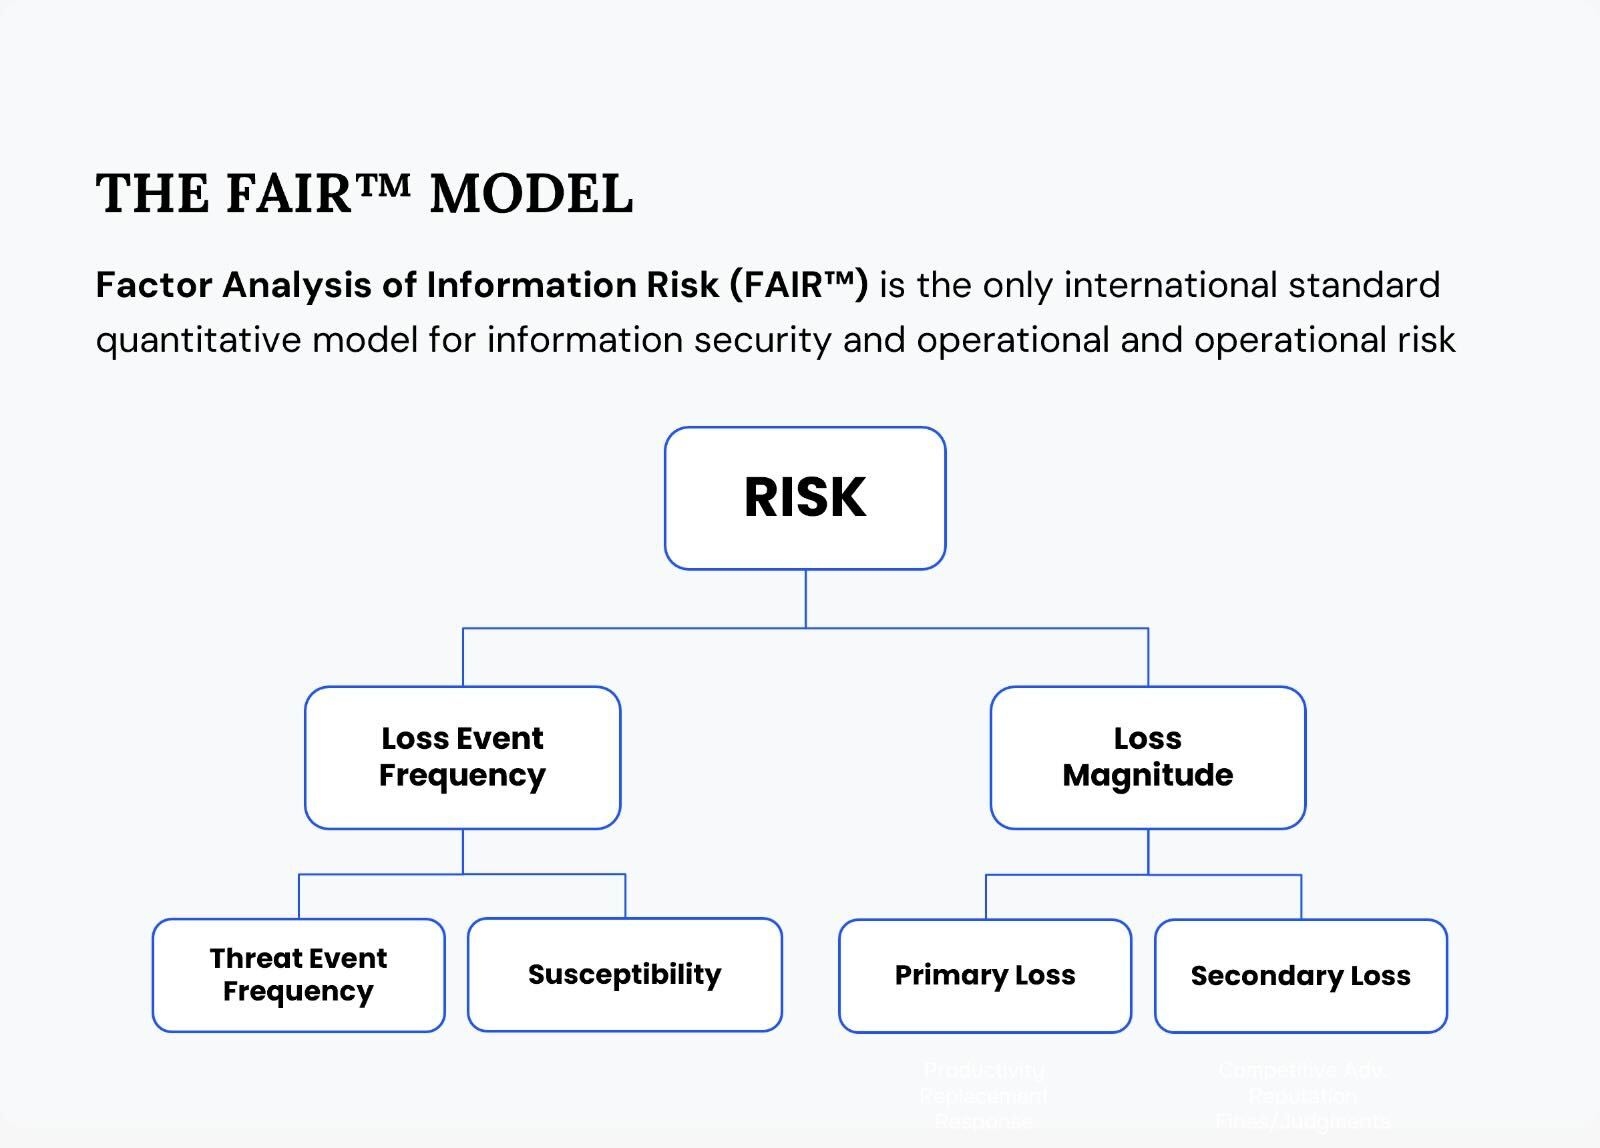
But trying to make all the factors come together for serious business use on a spreadsheet soon runs into thousands of rows and hundreds of formulas and worksheets to maintain – and copy/paste mistakes that can blow up all your work.
Data collection for the manual spreadsheet user is a steep hill to climb. Running down the right subject matter experts, fitting into their busy schedules, forcing them to make educated guesses on data when they lack confidence, can stretch out over weeks – then back at your desk, miss a variable or make an incorrect assumption and you may have to rework everything.
It’s tempting to skip ahead by taking shortcuts on scoping, the process of rigorously defining your risk scenarios for analysis and setting your data requirements –but skip that step and you risk the accuracy and ultimately the usefulness of your analysis.
Another exercise in frustration: Spreadsheets limit you to one effect or threat actor per risk scenario. You can’t readily assess complex scenarios with multiple threat actors, assets, and effects in a scalable manner to make defensible, risk-based decisions.
We’ve learned to recognize the symptoms of FAIR users who have gone in the DIY, spreadsheet direction; we call it “FAIR fatigue.”
Case of the Missing Controls
The original FAIR model doesn’t explicitly define controls. That’s a feature, not a bug, as FAIR was designed by Jack Jones to apply to any form of risk. But the controls environment in the cybersecurity world is highly complex and interdependent in relationships Jack calls “controls physiology”.
Jack wrote, “Personnel performing FAIR analyses have been expected to understand or figure out which controls are relevant to the scenarios they’re analyzing, and appropriately account for the effect of those controls on risk. Unfortunately, this can be very challenging without a clear understanding of controls physiology. Furthermore, the absence of a controls physiology model has made it impossible to reliably leverage security telemetry to automate risk measurements.”
Problem solved, almost. Based on Jack’s intuition, the FAIR Institute released the FAIR Controls Analytics Model (FAIR-CAM), an extension of the original FAIR, that maps controls physiology and quantifies the effect of controls on risk reduction. It just needs a software solution to make it a business decision-support tool.
We Make FAIR Scalable
SAFE has been on a mission to systematically overcome the barriers that block the way to scaling FAIR to meet the challenges of the current risk landscape and business environment.
Controls
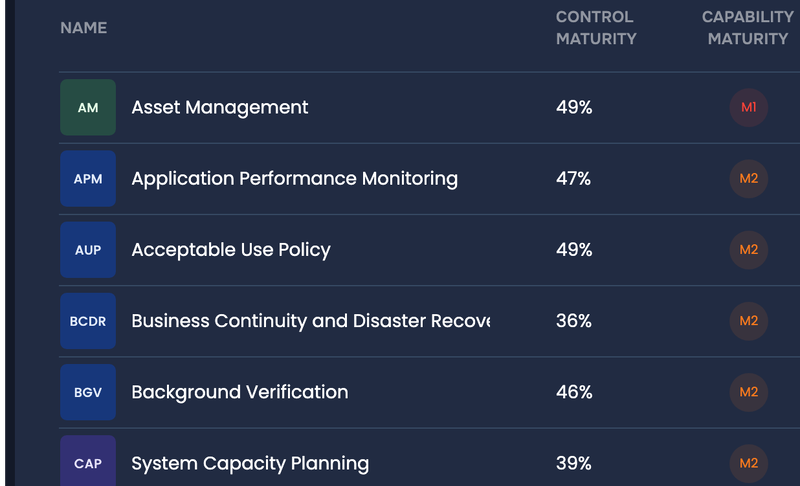
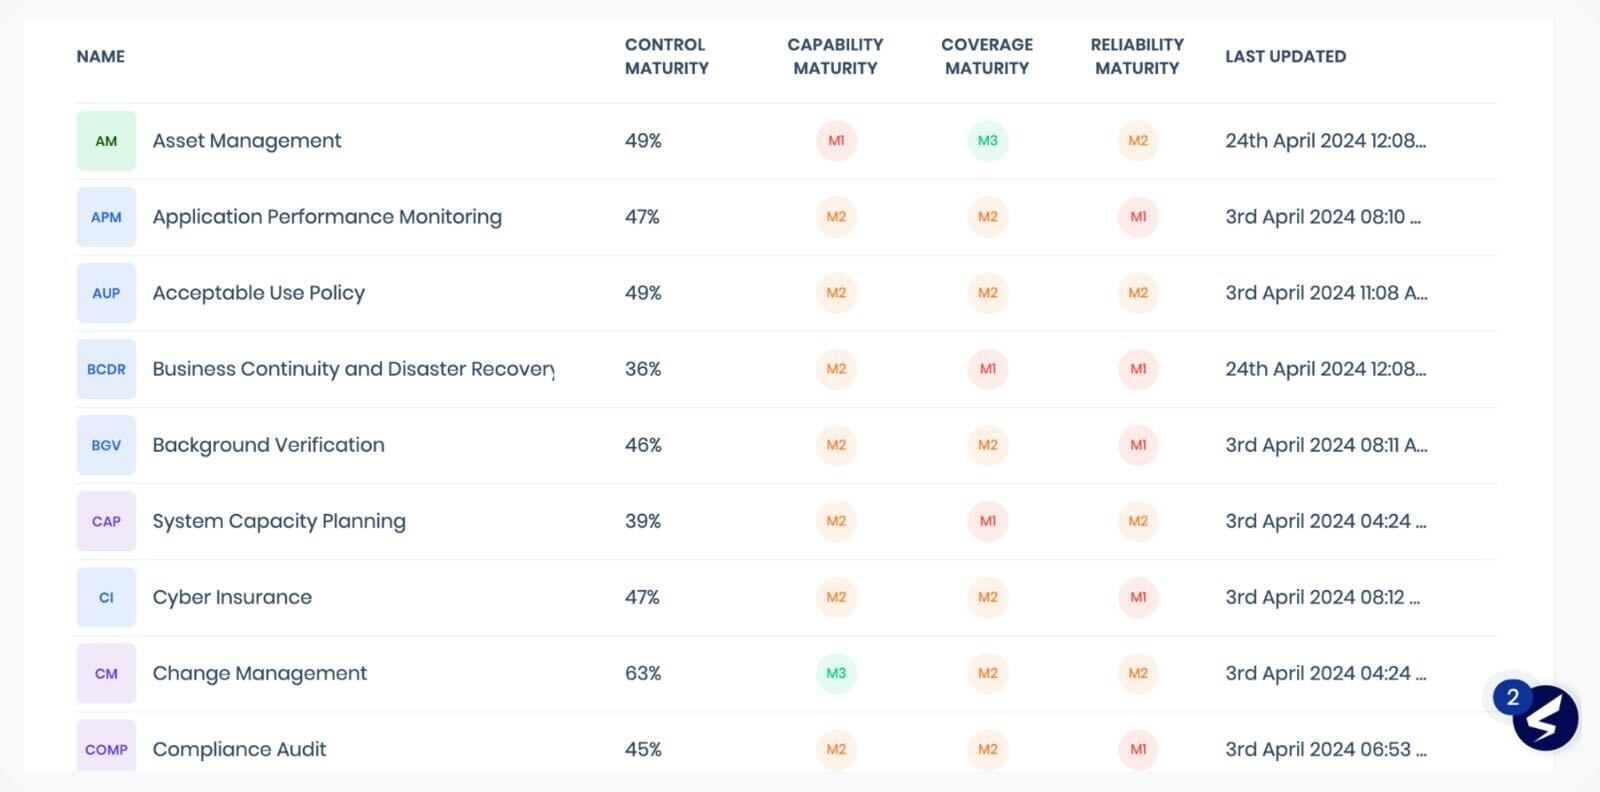
Our SAFE One platform natively integrates FAIR-CAM into a cyber risk management platform for automated analysis of controls effectiveness scientifically and transparently – no more subjective judgments. The platform ingests the roster of an organization’s controls and aligns it with FAIR-CAM. Real-time telemetry reports on the status of controls (SAFE One provides the largest set [100+] of integrations available in a cyber risk management solution). Platform users can run “what-if” analyses, changing the status of controls to see the effect on risk levels.
Data
The platform pulls in the latest in industry benchmark data for cyber event frequency and loss in financial terms to complement the organization’s own data. The loss data is ingested into another key extension of the FAIR standard, FAIR-MAM (Materiality Assessment Model), a standard loss model that breaks down losses like a CFO or an insurance company would. FAIR-MAM also provides a highly accurate data repository always on for reporting on the impact of a fresh cyber event or to model hypothetical events.
Risk Scenarios and Modeling
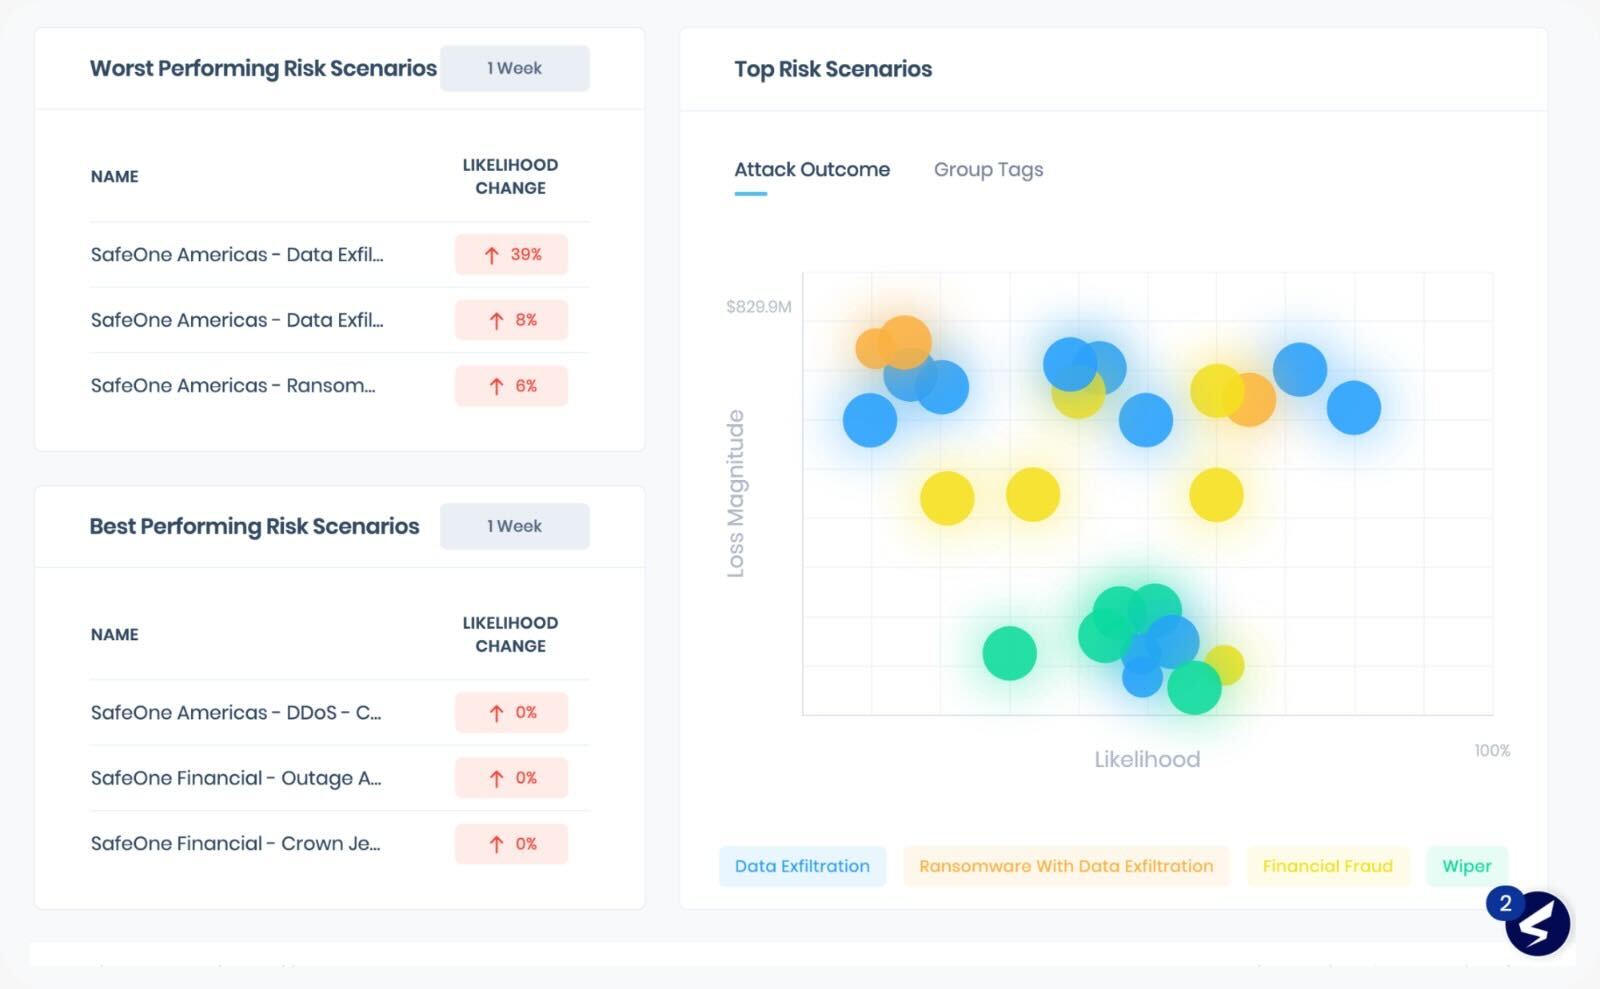
Risk scenarios are the basic tool of FAIR cyber risk quantification, and the SAFE One platform supports scenario modeling from multiple directions. Out-of-the-box risk scenarios solve the scoping issue. API-delivered telemetry reports on the status of the attack surface and controls in real-time for a reading on probable likelihood of loss. FAIR-MAM supplies the cost-drivers for any scenario for the reading of magnitude of probable loss. A dashboard displays the scenarios by risk level in terms of likelihood and magnitude. It’s all transparent and standards-based and open to inspection by drilling down through the results; as we like to say, “Never trust a risk score you can’t click.”
Benefits of a Scalable FAIR Solution such as SAFE One
- Ease of visibility and communication of cyber risk with quantification and scoring
- Operational prioritization, based on controls effectiveness
- Justification and planning: Identify the highest ROI initiative.
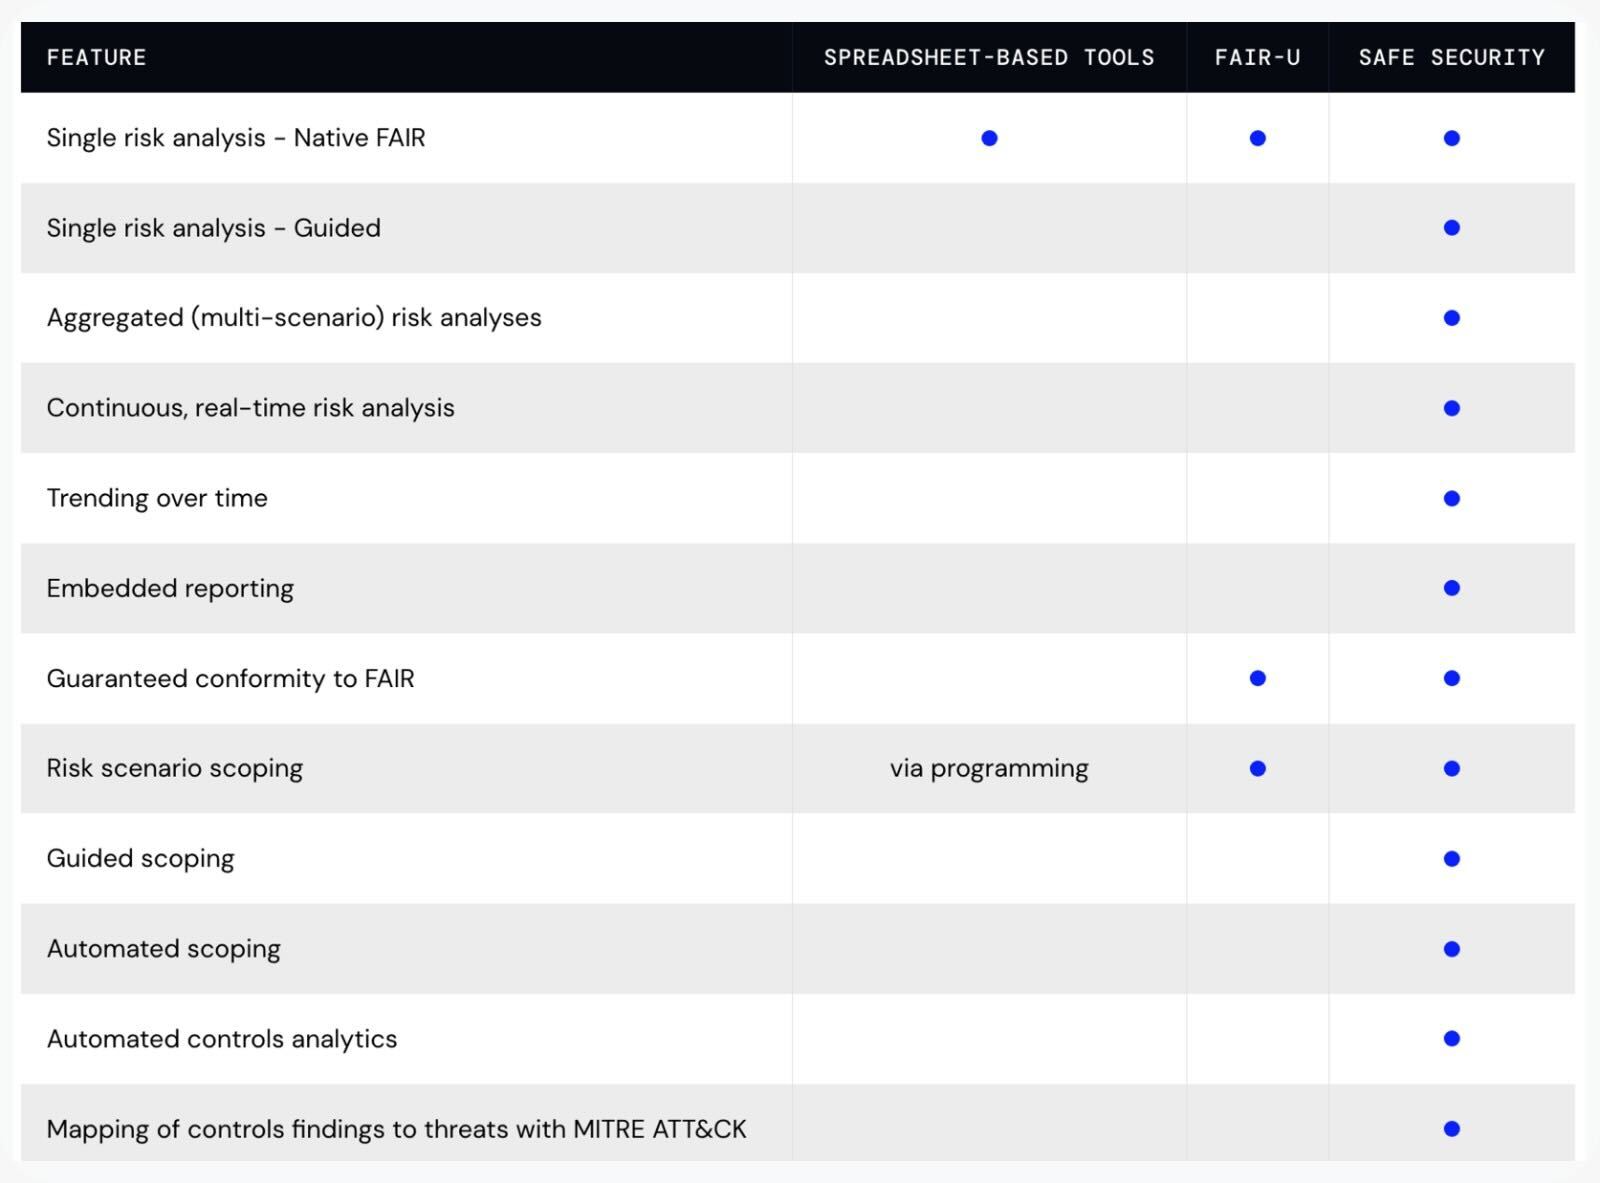
Comparison Chart: SAFE One Platform vs. FAIR-U Training Tool vs. Spreadsheets for FAIR Analysis
This is a partial view – Click here to see the complete chart
