Pros and Cons of the FAIR Model for Cyber Risk Quantification
We’ve made a systematic effort to solve all the Cons for an easy path to quantify risk in financial terms.
At SAFE, we are big boosters of Factor Analysis of Information Risk (FAIR™), the standard model for quantifying cyber risk. FAIR methodology is foundationally built into our SAFE One platform that simplifies and automates the key processes of FAIR risk analysis.
But we recognize that FAIR skeptics are out there – serious and thoughtful risk management professionals who take a “prove-it” stance. We love talking to them – they are our best source of guidance on how we can improve our message about the FAIR method of quantitative risk analysis and make SAFE One even more user friendly.
Let’s level-set on FAIR…
What Is Factor Analysis of Information Risk (FAIR)?
According to the FAIR Institute, “Factor Analysis of Information Risk (FAIR™) is the only international standard quantitative model for information security and operational risk. FAIR provides a model for understanding, analyzing and quantifying cyber risk and operational risk in financial terms.” Using FAIR, a risk analyst can break down a risk into component factors that can be quantified in part or whole.
FAIR Model, FAIR Framework, FAIR Standard – Which Is It?
FAIR is an analytical model that describes how risk factors interact with each other. FAIR is also an open standard that’s been vetted by experts and is available for anyone to build an application on. FAIR is not a framework, in other words, a catalog of items like the recommended controls and best practices for cybersecurity listed in the National Institute of Standards and Technology Cybersecurity Framework (NIST CSF). Important distinctions, but really people use the terms interchangeably.
What Is FAIR Cyber Risk Quantification (CRQ)?
“Cyber risk quantification” is a term now in wide use and broadly defined, frankly, to fit the needs of cybersecurity product marketers. Just about anything you put a number on counts as CRQ, including:
- A numeric “maturity level” achieved by installing more security products on a network
- A numeric “risk rating” generated from a “black box” application that scores your risk based on a proprietary (just trust us) process.
The problem with those methods: They don’t measure risk directly and don’t produce outputs that are useful and reliable for informed decision making by leaders of the business.
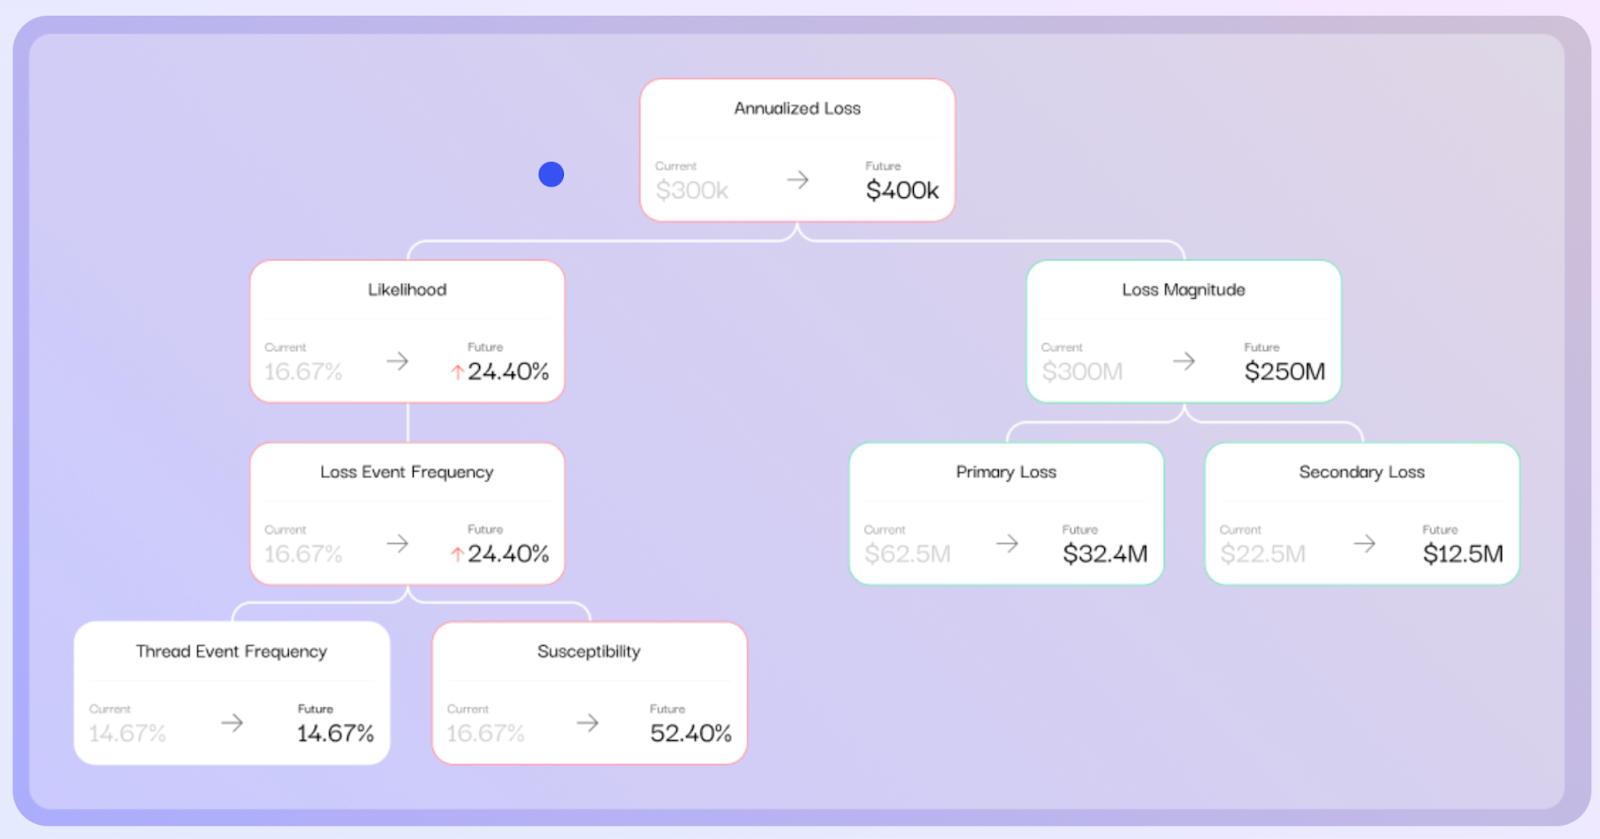
FAIR analysis takes a business-friendly approach to measuring risk. Every analysis quantifies a risk scenario, an event that would result in a specific effect on operations (say, a data breach in a particular business unit hitting personal health records). FAIR quantifies the likelihood of the event occurring in a year (expressed in percent) and the magnitude of financial impact (expressed in dollars), so that decision-makers can weigh likelihood vs. impact to fully understand their loss exposure, both from a single incident or on an annualized basis.
FAIR Methodology Pro and Con
Let’s turn the doubters loose. Here are the Cons, objections we hear most often about Factor Analysis of Information Risk. We’ve made a systematic effort to solve every known Con and turn each into a Pro, also listed. But you be the judge.
Con: Who needs CRQ? Compliance is still the proven way to go.
A compliance-based approach starts with a framework like the NIST CSF and infers that the more controls or processes you adopt off the list, the less risk you must have. Sounds reasonable, and following the CSF or similar framework is the most widely accepted way to structure a cyber risk management program. (The CSF even recommends FAIR as a best practice.) But the compliance approach doesn’t measure risk or risk reduction – it measures compliance. You can’t assess the effectiveness of cybersecurity controls and prioritize among them to guide deployment decisions.
Pro: With FAIR, you can quantitatively assess controls effectiveness with FAIR-CAM (Controls Analysis Model).
Compliance still has an important role to play by providing an inventory of controls in place. The platform ingests the roster of an organization’s controls and aligns it with FAIR-CAM. Real-time telemetry reports on the status of controls (SAFE One provides the largest set [100+] of integrations available in a cyber risk management solution). Platform users can run “what-if” analyses, changing the status of controls to see the effect on risk levels.
Con: Results of FAIR analysis are difficult to interpret. We’re used to presenting simple red/yellow/green risk ratings and our business leadership is used to seeing them.
How you choose to present analyses to management is up to you. It’s how you generate those results that counts. Risk ratings by in-house experts color-coding risks based on their subjective judgments or ratings from black-box ratings services simply aren’t defensible.
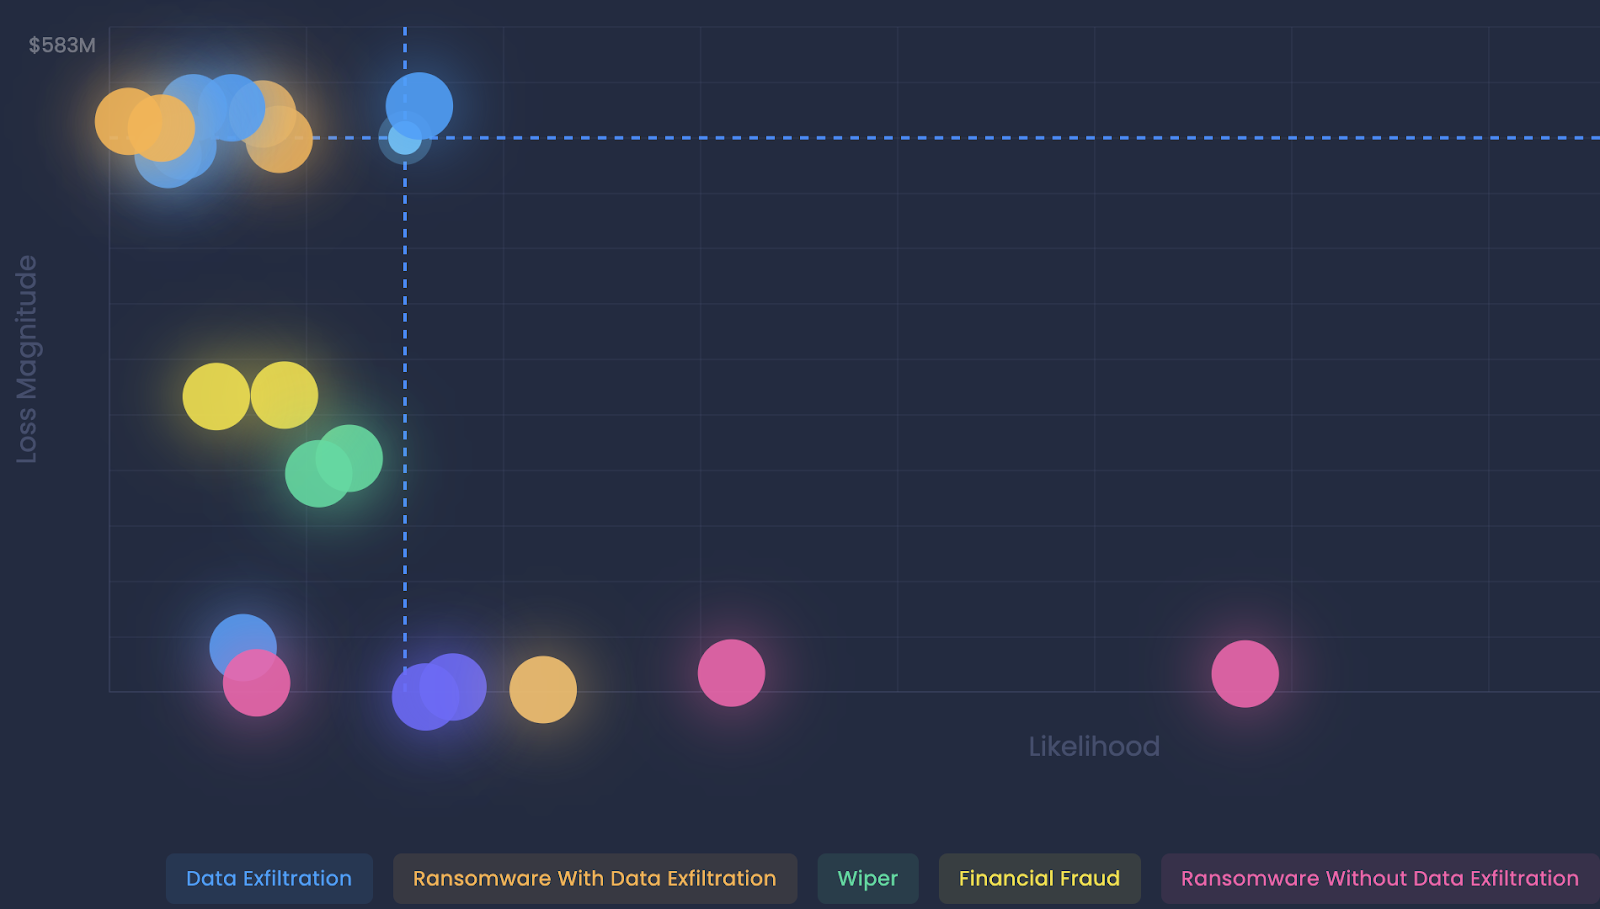
Pro: A top-risks analysis with FAIR, ranks risks based on probable frequency of occurrence and magnitude of impact using a recognized open standard.
We find this presentation (from the SAFE One platform), displaying risk on an x-y axis of frequency vs. magnitude is instantly recognizable to technical and non-technical business leaders alike – and leads to more actionable discussions with your management than a static heat map.
Con: FAIR doesn’t scale. It’s too slow, too manual, too time-consuming.
This isn’t really a criticism of FAIR, it’s about the available tools for FAIR risk analysis. In early days, FAIR fans had to construct elaborate spreadsheets to run analyses, with thousands of rows and hundreds of formulas. One copy/paste mistake could blow up all your work. Data collection meant running down the right subject matter expert and trying to pin them down on estimates for the FAIR risk factors. Another serious limitation of spreadsheets: You can’t readily assess in one pass multiple risk scenarios with multiple threat event actors and effects.
Pro: We’ve cracked scaling problems with automated functionality of the SAFE One platform.
Data feeds pull in the latest in industry benchmark data for threat event frequency and loss and pull in the latest readings from an organization’s telemetry. Data is ingested into FAIR-MAM (Materiality Assessment Model), a standard loss model that breaks down losses like a CFO would, and stores them in a data repository for instant availability in risk analysis. The platform includes a large library of over 120 pre-formatted cyber risk scenarios that can be tapped to run many analyses simultaneously for “what-if” comparisons.
Con: The risk landscape is too dynamic, with changing threat actors and threats all the time, so effectively measuring cyber risk is hopeless.
“Dynamic” – yes indeed. Just look at the recent failures of third party cyber risk management, overtaken by supply-chain attackers exploiting weaknesses created by defenders still stuck in a compliance mentality when they should move to risk-driven solutions that enable enterprises to proactively cooperate with vendors on deployment of key controls.
Pro: The SAFE One platform unites first- and third-party risk in a single, FAIR-powered view of risk exposure
Recent events have driven home the value of the SAFE One approach by clarifying that organizations have one attack surface, no matter if the threat initiates directly from a threat actor or indirectly through a third party. Second critical point: Real-time data gathering on the attack surface is a must-have. SAFE One accomplishes that with more than 100 integrations with the leading security tools and products, scoped according to the MITRE ATT&CK framework.
Got some other Cons, uncertainties, or just open questions in mind? We’d love to talk to you.
Contact us to speak to a FAIR expert and see FAIR analysis in action on the SAFE One platform!