When architecting a cybersecurity risk program, organizations often find it challenging to organize the wide variety of loss-event scenarios into risk identification reporting that makes sense to those responsible for managing it. Risk identification reports should be tailored to provide quantitative risk analysis information that is useful to the audience it will be presented to, whether that audience is made of board members, c-suite executives, or other risk managers.
This blog post assumes that your organization has already moved towards effective cyber risk management based on quantitative risk assessment reports and away from subjective red-yellow-green assessments, high-medium-low qualitative risk assessments, and heat maps, which are not adequate to make well-informed risk management decisions. With that in mind, we can now focus on a summary of the quantitative risk assessment reporting process and stratification into useful reporting levels.
When working with RiskLens customers, I have noted two common levels of operations and reporting: Tactical Cyber Risk Reporting and Strategic ERM, C-Suite, & Board Reporting.

Tactical Cyber Risk Reporting
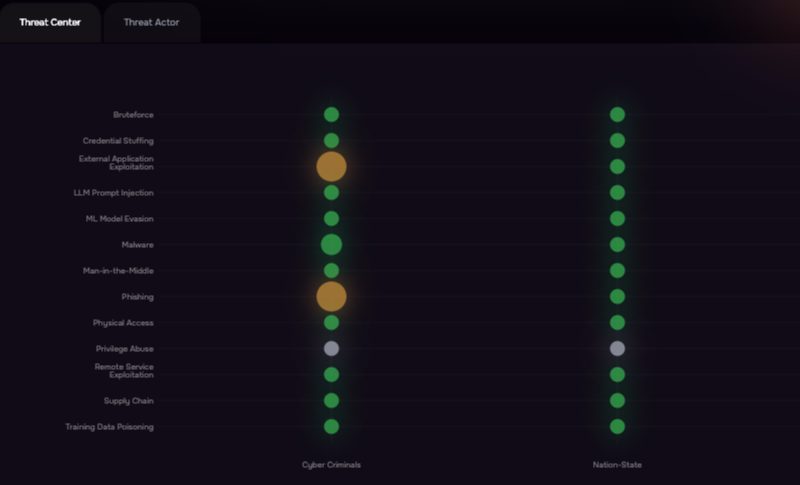
Daily operations risk scenarios are introduced into the company constantly through multiple sources. The illustration below provides an example of a common pipeline of activity. Each of these activities, at inception, may or may not represent cybersecurity or technology risk.

Common sources of risk include audit findings, policy exceptions, control variances, incident management, threat observations, or project risk evaluations. The pressure valve within this pipeline represents the person or department responsible for managing the intake.
This pipeline of observations, issues, or incidents needs to be evaluated to determine if the scenarios represent risk events to the organization. Beyond the pressure valve, cyber and tech risk analysts reformulate this incoming pipeline of issues into meaningful risk scenarios. Each risk scenario is scoped to include one or more assets at risk, threat agent(s), and loss effect(s). Reporting at this level is normally structured to enable well-informed tactical decisions like policy exceptions, variances to pre-established acceptable conditions, or mitigation options and prioritization.
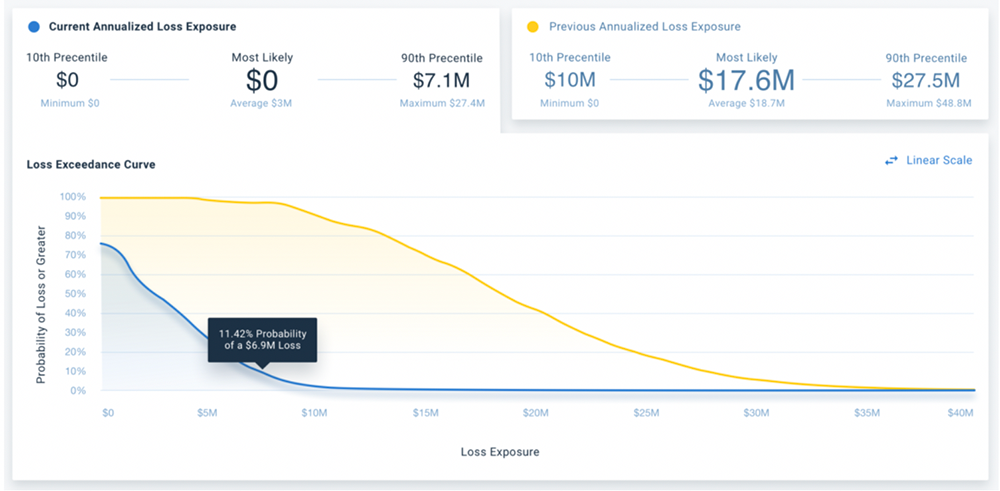
Below is an example of a single audit finding scenario analysis report showing unacceptable control efficacy (with a $17.6M most likely loss exposure) and compliant control efficacy (at $0 most likely loss exposure).
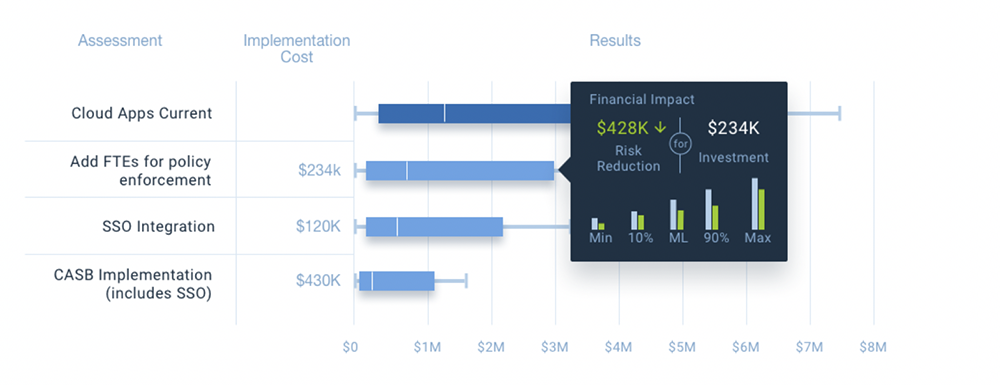
The illustration below is an example of an aggregated analysis enabling well-informed project prioritization. It is a side-by-side comparison of four project analyses showing loss exposure and estimated mitigation cost. Each scenario can be evaluated to determine the best ROI for mitigation resources.
Strategic ERM, C-Suite, & Board Risk Quantification Reports
Strategic quantitative risk reports are not a reformulation of daily operational risk reporting. Instead, these reports are a top-down, big-picture focus on cybersecurity risk that could materially impact the organization. Senior leadership already has significant experience determining organization risk appetite and tolerance levels for strategic, compliance, operational, financial, and reputational risk. They want to make effective comparisons between those forms of risk and cybersecurity risk.
Instead of re-purposing tactical cybersecurity risk reporting, a CISO or CTRO can efficiently guide the risk team to identify the most significant confidentiality, integrity, and availability scenarios for each department or business unit.
The graphic below illustrates a pipeline of top risk scenarios for each business unit. The pressure gauge represents the concentration of assessments that need to be periodically updated to ensure risk scenarios are managed over time (quarter/quarter, and year/year). Reporting is structured much differently than day-to-day tactical operations. Here, reports are focused on strategic, big-picture reports helping ERM, C-Suite, and Boards answer the “so what” question. “How much material risk do we have, and what are we doing about it.”

The Board, C-Suite, and ERM level personnel are focused on KRIs, specifically measurements determining the probability, frequency, and magnitude of events that exceed the organization’s risk appetite. Their primary concern is events with consequences that could exceed the organization’s risk appetite and have a profoundly negative impact on its ability to be successful. KPIs are performance indicators/gauges and measurements the organization uses to understand how well business units are performing against their risk management goals. If cybersecurity reports identify material risk, then expect the Board, C-Suite, and ERM personnel to ask for a strategic mitigation strategy and a timeline for reducing identified risks.
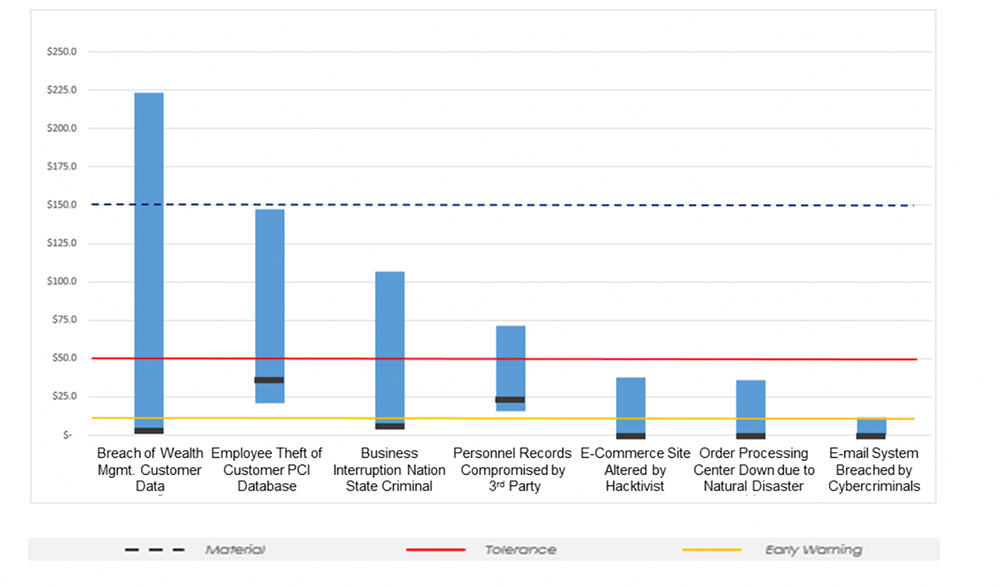
The illustration below is an example of an organization’s top 7 risk scenarios. Immediately, one understands how much risk is within pre-established tolerance and materiality thresholds.
3 Steps to Set a Risk Appetite for Cyber Risk Management Reporting
- Step 1 – Identify the loss event type(s) that are most relevant
- Step 2 – Define thresholds for “unacceptable” loss exposure
- Step 3 – Validate risk appetite value(s) using a sample of quantitative risk scenarios and obtain buy in
In summary, when it comes to cybersecurity reporting, know your audience. Tactical cybersecurity reporting on analysis results, like control efficacy degradation, variance to policies, and pre/post-mitigation analysis, is extremely useful to those responsible for directly managing cybersecurity and technology risk, but is generally too tactical for ERM, C-Suite, and Board personnel. Senior executives and Boards focus on big-picture strategic issues, and need quantitative risk assessment reports to match.
For a detailed look at the results and benefits of quantitative risk analysis and reporting, find out how RiskLens analysts helped a large financial institution understand their loss exposure and then choose the most cost-effective control — with a payoff of an $11 million reduction in loss exposure. Read the case study.


