Re-Tuned: Understanding the Risk-Based Scoring of SAFE’s Findings Prioritization
Focus your resources on the vulnerabilities that pose the greatest threat to your organization.
By Jacqueline Lebo and Nimmi Sharma
The goal of this post is to provide a clear and informative explanation of how we use the SAFE platform to prioritize vulnerabilities—or “findings”—to help you build a more robust cybersecurity posture.

Our approach is centered around the FAIR-CAM framework. FAIR-CAM, an extension of the open-industry-standard FAIR model for cyber risk analysis, allows us to go beyond traditional vulnerability management by linking controls directly to risk. This enables us to not only identify weaknesses but also measure the value of a control’s ability to reduce risk. At the heart of this process is our method for scoring and prioritizing findings, which ultimately informs the reliability score of your controls.
This entire process ensures that you’re not just reacting to a long list of technical vulnerabilities. Instead, you’re getting a data-driven, risk-based prioritization of your findings, allowing you to focus your resources on the weaknesses that pose the greatest threat to your organization.
Data Points: The Ingredients of Our Scoring
To accurately prioritize findings, our model requires a few key pieces of information for each one. This data is the foundation of our scoring and ensures that our prioritization is tailored to your unique environment.
- Severity Score: This is the base-level score of the finding, typically on a scale of 0 to 10. It’s calculated using the CVSS or CCSS scoring framework.
- Failed Assets: We need to know the count of assets where a particular finding is currently open.
- Internet-Facing Assets: We count how many of the failed assets are directly accessible from the internet.
- Exploitability : This is a binary flag (true or false) that tells us if a finding is exploitable by threat actors. In other words, a finding that is historically known to be exploited by adversaries in order to gain initial foothold or during the lateral movement/exfiltration stage. Exploitability has a significant impact on Findings score.
- Threat Intel Informed Finding (TIIF): This is also a binary flag (true or false). A finding that has been recently exploited by adversaries as per the daily threat event analysis process of SAFE Threat Center. The path to derive a TIIF is based on the Exploitable Finding framework. In other words, all TIIFs are Exploitable Findings, but they generally carry a higher impact on likelihood in FAIR-based cyber risk analysis.
- Age of the Finding: We measure how long a finding has been open in your environment.
- Age of the CVE: We track the age of the Common Vulnerabilities and Exposures (CVE) identifier associated with the finding.
- Business Context: We consider whether the finding is located on a business-critical asset.
Methodology: The Findings Prioritization Process
Our methodology is a six-step calculation that builds a comprehensive score for each finding. This process is designed to account for the most critical factors influencing risk.
Step 1: Age Index Calculation
We begin by calculating an Age Index. This index is a logarithmic value derived from the sum of the finding’s age and the CVE’s age. This step is a foundational element in our methodology, as it’s the first step in our process of applying the impact of aging on the severity of the finding.
Step 2: Accounting for the Impact of Aging
Next, we factor in the impact of aging. A finding is considered “aging-applicable” if its severity score is 7.0 or higher, OR if it’s a High Impact Finding (see Step 7 below). If either of these conditions are met, we apply an aging factor to the severity score. Otherwise, no aging decay is applied.
Step 3: Including the Impact of Exploitable Findings
Exploitable findings are given special weight in our model. If a finding is Exploitable, we multiply the value from the previous step by 500 to reflect its magnified risk. If it’s not Exploitable, we do not apply this multiplier.
Step 4: Incorporating Business Criticality
For Exploitable findings, we apply a business criticality factor. This ensures that critical findings on your most important assets are given the appropriate weight.
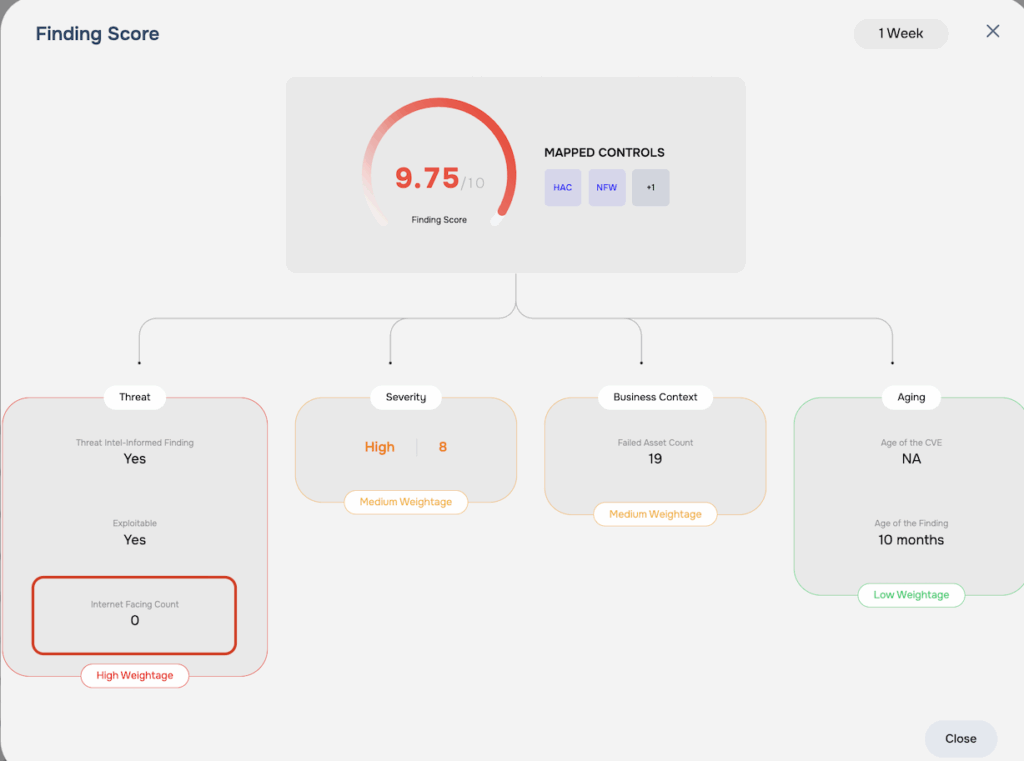
Step 5: Adjusting for Internet-Facing Assets
The exposure of an asset to the internet is a major risk factor. We modify the count of internet-facing assets based on the finding type:
- If it’s an Exploitable Finding: We inflate the count of internet-facing assets by multiplying it by 5.
- If it’s a Non-Exploitable Finding: We reduce the count of internet-facing assets by dividing it by 100.
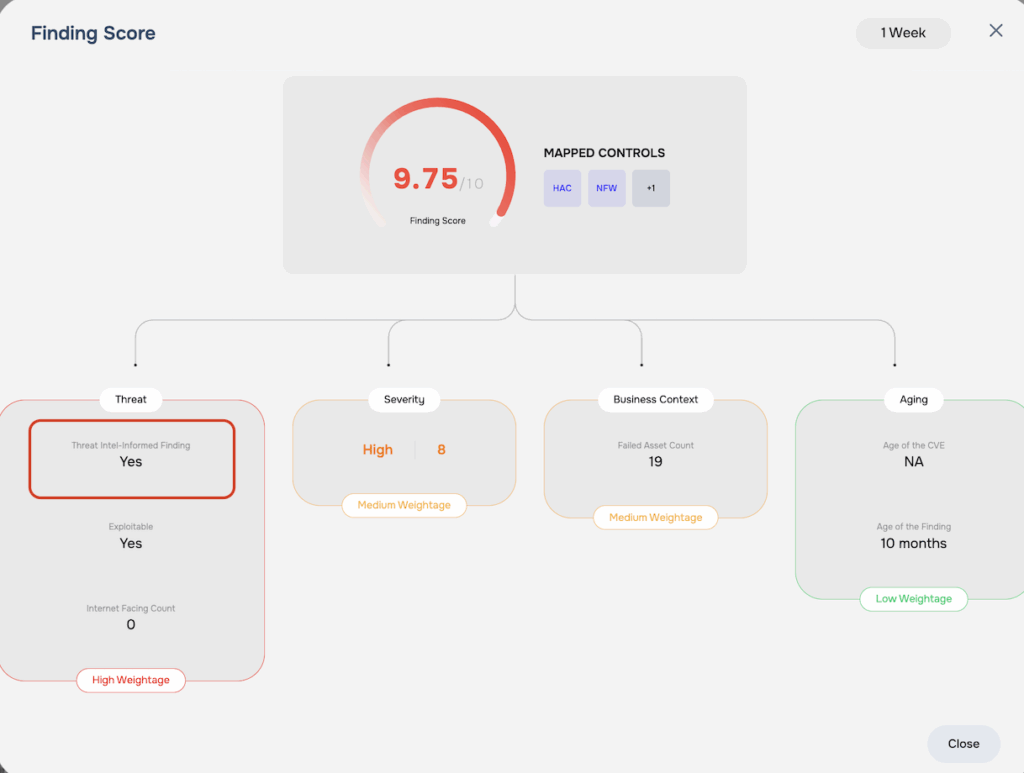
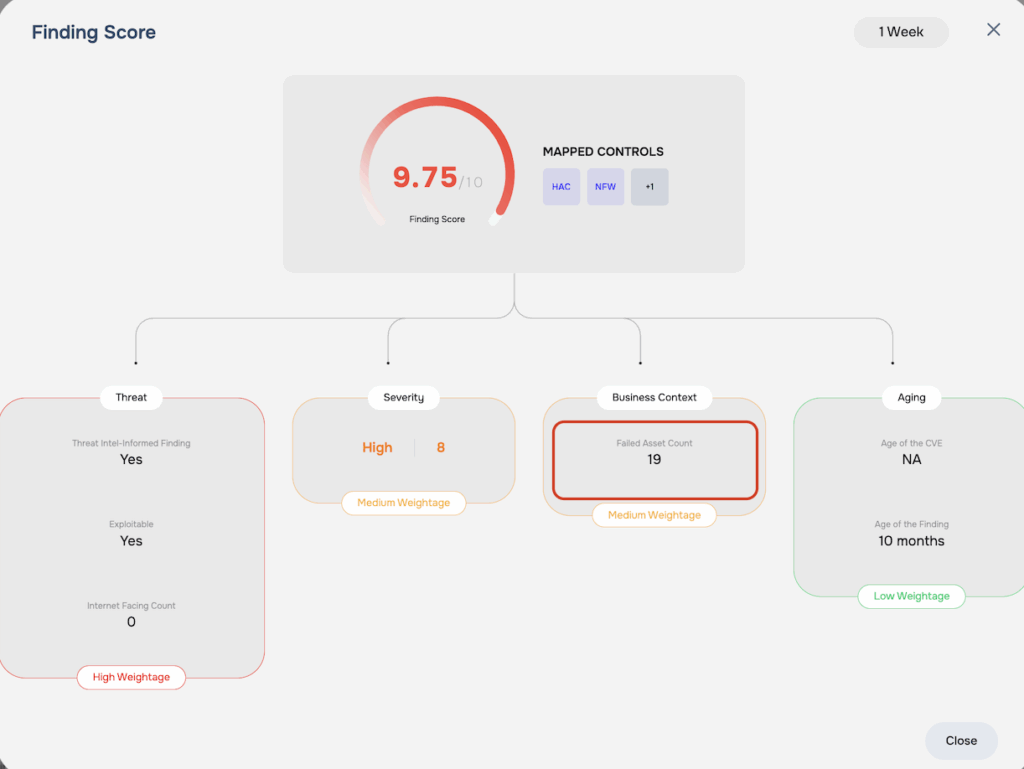
Step 6: Adjusting for Threat Intel Informed Finding (TIIF)
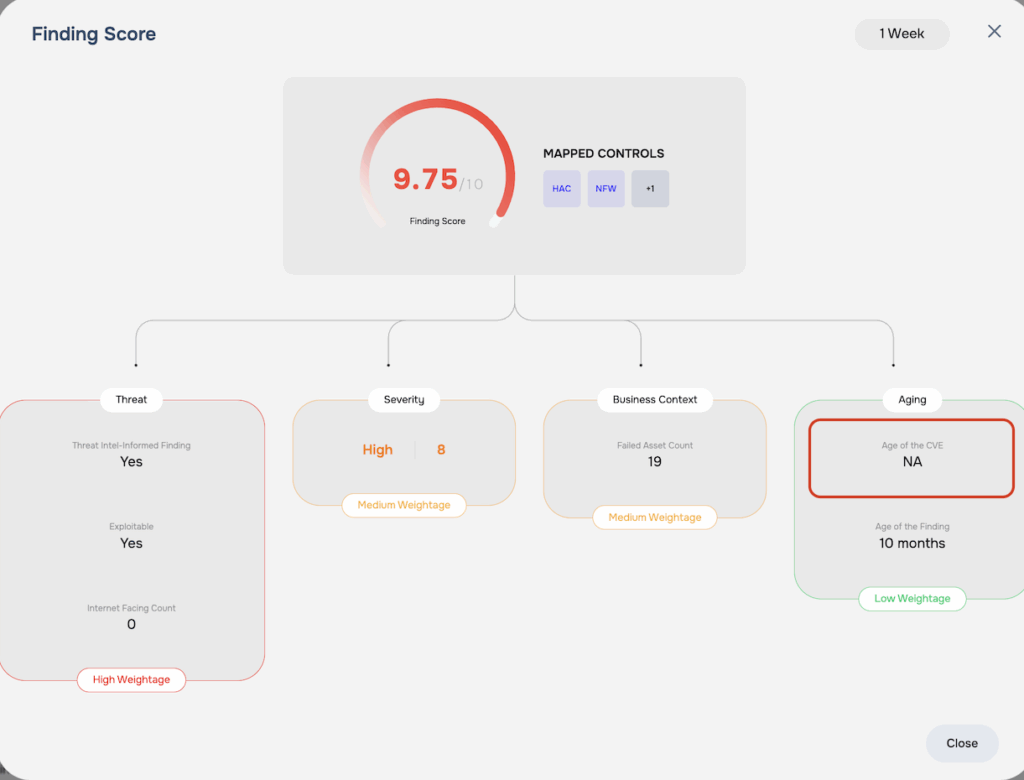
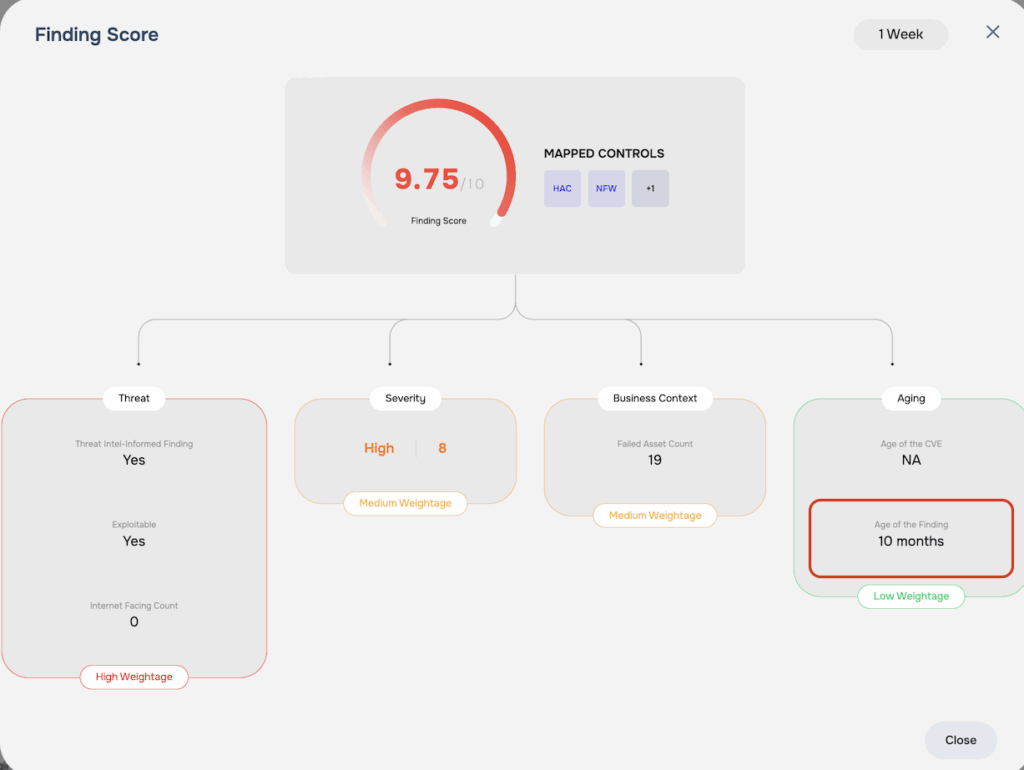
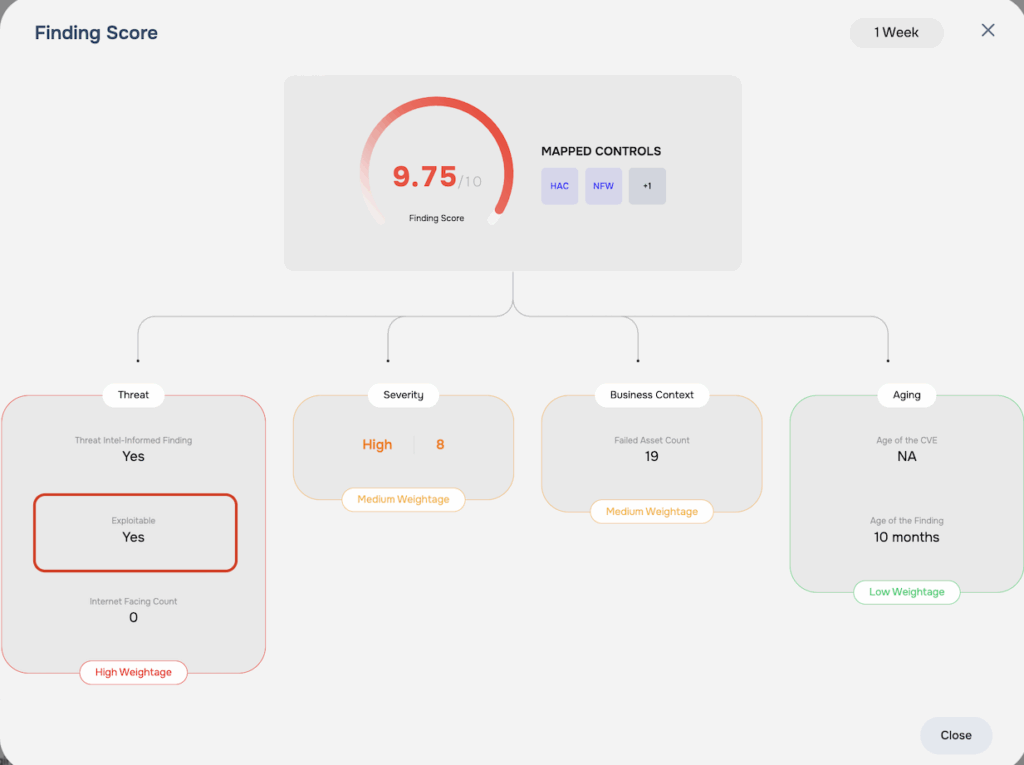
All TIIFs have a minimum score of 9.75, and accordingly the calculated value above is summed with the score corresponding to 9.75 on top of the value obtained in the last step to raise the findings score to a minimum 9.75.
Step 7: Deriving the Final Finding Score
The final finding score represents the culmination of all prior steps. It is derived by combining the value from Step 4 with the number of failed assets and the adjusted count of internet-facing assets. The exact formula applied varies depending on whether the finding is TIIF, Exploitable, high-severity non-exploitable, or lower-severity. This approach ensures the score accurately reflects the unique risk profile of each finding.
Note: Findings with a score of 9.75 or higher are classified as High-Impact Findings (HIFs) according to SAFE’s internal definition. These findings are not necessarily TIIFs (but all TIIFs are HIFs). High-Impact Findings are exploitable by attack groups, carry a high severity score, and are typically present across multiple assets within the organization. When a HIF is identified in a customer’s environment, the Loss Event Frequency (LEF) values in FAIR cyber risk analysis increase significantly, leading to a higher likelihood. This increase results from shifts in Susceptibility, Threat Event Frequency (TEF), or both, depending on whether the finding is associated with a resistance, avoidance, or deterrence control. Both HIFs and TIIFs have a findings score of 9.75 or higher.
Final Step: The Reliability Score
At the end of the day, our ultimate goal is to give you a clear, single number that tells you how well your cybersecurity defenses—your FAIR-CAM controls—are working. We call this the Reliability score, and it’s a measure of how maturely a control is managed. Think of it like a check-engine light for your security controls; it tells you if they’re running as they should.
To get to this score, we first calculate a Population Score. Imagine you have a team of security guards (your controls) protecting a building (your assets). When a door is left unlocked or a window is broken (a finding), each incident gets a score based on its severity and location. The Population Score is simply the total sum of all these individual finding scores for a given control. For example, if a security guard is responsible for a set of doors and windows, the Population Score is the total risk from all the unlocked doors and broken windows they’re supposed to be watching.
Next, we take this Population Score and run it through a formula to get the final Reliability score. It converts a large, unwieldy score of all your weaknesses into a single, easy-to-understand percentage. It’s a bit like taking all the complex data from your car’s engine and translating it into a simple gauge on your dashboard.
Finally, we put a cap on the Reliability score, keeping it between 5% and 95%. This is our way of being honest and transparent. We know that no system is perfect, and there are always “known unknowns” that our model can’t see. Setting these limits prevents us from overstating a control’s effectiveness, giving you a more realistic picture of your security posture.
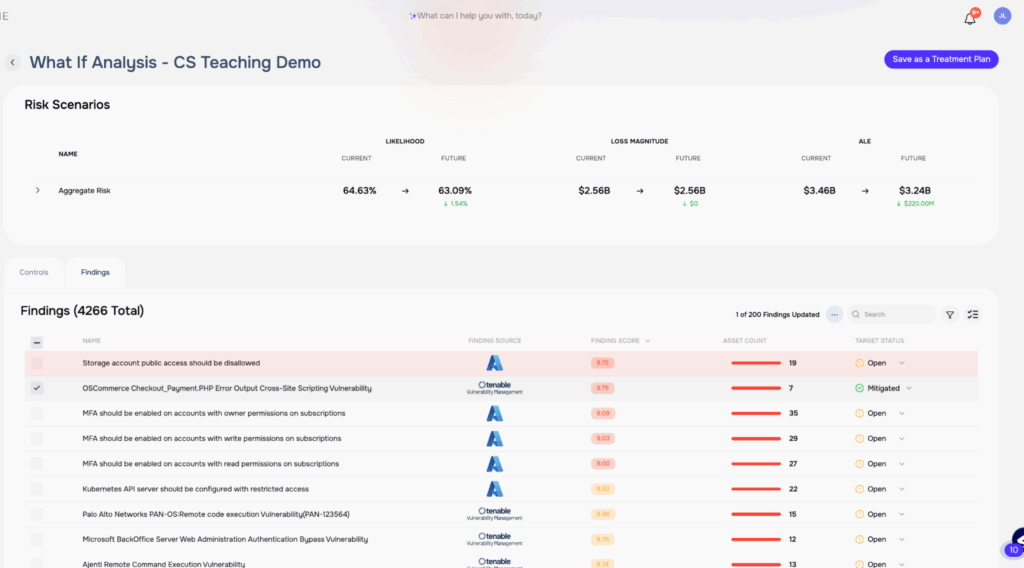
What-If Analysis on the SAFE One Platform
If your competitor is attacked through a vulnerability and you want to do what-if analysis, how does that happen? In the example below, line item 2 is the competitor finding and above that is the analysis generated by the platform showing how much risk would be reduced by remediating the finding.
Learn more: How SAFE Is Transforming Cyber Risk Management for a Secure Digital Future