Continuous Threat and Risk Monitoring Using SAFE and the Verizon DBIR
How to turn top data breach trends into daily, actionable cyber risk scenarios
By SAFE Threat Research Team
The 2025 Verizon Data Breach Investigations Report (DBIR) offers one of the most comprehensive snapshots of the global breach landscape, analyzing over 12,000 confirmed breaches across industries, regions, and threat vectors.
But for security leaders, the real challenge isn’t just understanding what happened — it’s using these patterns to predict which threats are most likely right now, pinpoint where you’re most exposed, and act before attackers strike. That’s where a shift from annual breach analysis to continuous, scenario-based risk modeling becomes critical.
This blog bridges that gap. It breaks down the DBIR’s top breach trends and shows exactly how to turn them into daily, actionable risk scenarios so your team can simulate real attack paths, monitor live likelihoods, and prioritize the mitigations that deliver the biggest impact.
What Did We Learn from the Verizon DBIR 2025?
The DBIR 2025 provides statistical clarity on how today’s breaches unfold across vectors, outcomes, and sectors. Key insights include:
- Ransomware remains dominant, appearing in 44% of breaches. It is often paired with data exfiltration in double extortion attacks.
- Credential misuse is the most common initial attack method, appearing in 22% of breaches. Most involve previously stolen credentials via infostealers.
- Human error is everywhere — 60% of breaches include a human element, such as misconfigured systems, misdelivery, or poor endpoint hygiene.
- Third-party involvement is rising — 30% of breaches involve partners, vendors, or service providers, often outside direct control.
- AI-enabled phishing and impersonation are emerging at scale, lowering the barrier for targeted attacks.
These trends are not theoretical — they reflect real breaches and real attacker behaviors, many of which are observable and repeatable.
Why these Attacks Matter: Quantifying Impact across Breach Outcomes
The DBIR doesn’t just highlight how attackers get in—it shows what they accomplish once inside. These attack outcomes have real business impact, from ransomware and data theft to financial fraud and system outages.
Each outcome results from multiple attack vectors, human lapses, and missing controls. Correctly modeling them is the first step toward quantifying breach likelihood. Here’s how the most frequent DBIR outcomes map to initial attack methods and operational consequences:
| Attack Outcome (AO) | DBIR 2025 Prevalence | Common Initial Attack Methods | Business Impact |
| Ransomware (with Data Exfiltration) | 44% of breaches |
|
|
| Data Exfiltration | Often paired with ransomware |
|
|
| Financial Fraud | Observed in targeted sectors |
|
|
| Wiper | Low frequency, high impact |
|
|
‘Many of these outcomes begin with the same familiar entry points: weak credentials, unmonitored vendors, unpatched systems, or risky user behavior.’
Recognizing these risks is only the starting point. Real risk assessment requires going deeper, to answer questions like:
- How likely is ransomware to occur in my environment?
- Which attack paths could lead to it?
- What controls could reduce its probability?
That’s precisely what scenario-based risk modeling enables. In the next section, we break down ransomware as a case study, tracing how it arises from known initial attack methods and how its likelihood can be monitored daily.
Section 1: Modeling Ransomware as a Risk Scenario: Attack Paths, Techniques, and Daily Likelihood Monitoring
While ransomware continues to be the most frequently observed breach outcome in DBIR 2025, the more important question is how attackers are getting in.
Recent research from SAFE in collaboration with MIT Sloan reveals a startling trend: as much as 80% of modern ransomware attacks are powered by Artificial Intelligence (AI). The ability to use AI for rapid adaptation, smarter evasion, and scalable attacks has drastically amplified the reach and impact of these attacks.
SAFE’s Threat Research Team analyzed more than 3,200+ ransomware events over the past year and observed a consistent pattern — attackers aren’t relying on rare or complex zero-days. Instead, they consistently exploit a handful of Initial Attack Methods (IAMs) that offer scalable, low-friction entry to enterprise environments.
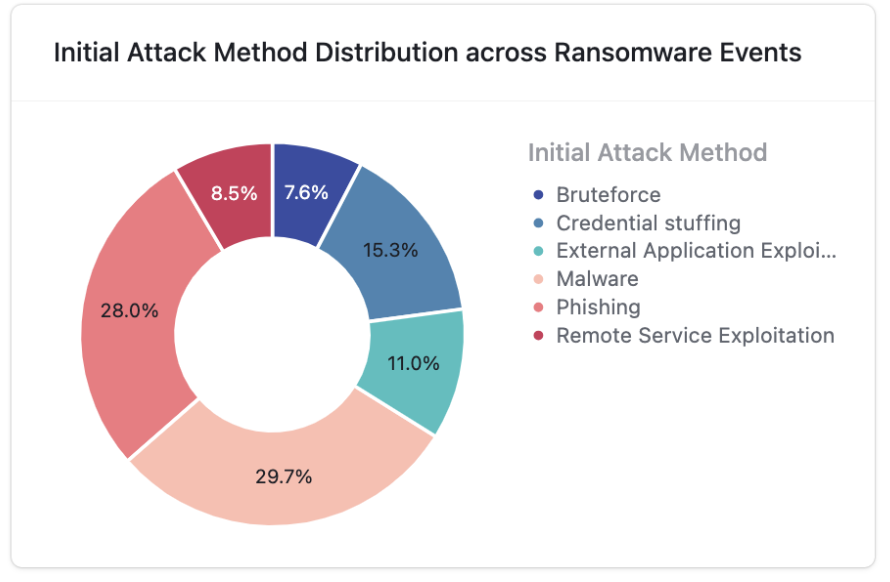
Image 3.1 – Initial Attack Method (IAM) Distribution Across 3200+ Ransomware Events
| # | Initial Attack Method | Description and Example |
|---|---|---|
| 1 | Malware (29.7%) | Malware remains the top entry point for ransomware (30% of cases), with infostealers and loaders silently harvesting credentials and system data for later use. Example: TransferLoader malware leveraged trusted platforms like GitHub or Dropbox to deliver info-stealers, which then enabled ransomware payloads like Lumma and Raccoon inside corporate networks. |
| 2 | Phishing (28%) | Phishing is the second most common path (used in 28% of observed cases). It is an easy, highly successful method for attackers to trick users and gain internal access. Example: In 2025, the Silent Ransom Group (UNC3944) targeted U.S. law firms with phishing emails, dropped remote access tools, and used stolen credentials to escalate privileges and encrypt sensitive legal data. |
| 3 | Credential Stuffing (15.3%) | Nearly 15% of cases start with attackers reusing stolen credentials to breach login portals or misconfigured assets. Example: In April 2025, attackers used stolen API keys to access AWS S3 buckets and cloud accounts, deploying ransomware across misconfigured environments. |
| 4 | Exploiting Vulnerable External Apps (11%) | In 11% of ransomware incidents, attackers exploited outdated or misconfigured public-facing apps to gain a foothold and deploy ransomware. Example: In late 2024, the PSAux campaign exploited a zero-day in CyberPanel, compromising over 22,000 servers globally and encrypting files at scale. |
Disrupting the Ransomware Path: Attack Techniques and Security Controls Relationship
Every Ransomware Path Starts Somewhere
Every ransomware attack begins with an Initial Attack Method (IAM) and ends with a disruptive outcome. Whether the threat actor enters through a phishing email or exploits a misconfigured cloud service, the end goal remains the same: encrypt valuable data and demand payment. However, each attack path reveals specific weaknesses and, therefore, specific defensive opportunities.
Map IAM to Techniques
By breaking down these attack paths into MITRE ATT&CK techniques and aligning them with FAIR-CAM Controls, organizations can proactively simulate and disrupt ransomware attacks before they cause damage. Below is a consolidated view of the most common IAM → Ransomware combinations observed over the past year and the techniques and controls that map to them.
Link to FAIR-CAM Controls
| IAM → AO | Most Commonly Used MITRE ATT&CK Techniques | FAIR-CAM Controls |
| Malware → Ransomware |
|
|
| Phishing → Ransomware |
|
|
| Credential Stuffing → Ransomware |
|
|
| External Application Exploitation → Ransomware |
|
|
What’s Your Real Ransomware Risk? Simulate and Reduce It Today
Understanding ransomware trends is helpful, but not enough. What matters is how those trends translate to your environment, your controls, and your breach likelihood. SAFE lets organizations simulate ransomware scenarios based on specific Initial Attack Methods (IAMs) and quantify their risk.
Simulate & Prioritize Defenses
SAFE ties it all together:
- Simulate each IAM → Ransomware path
- See which controls reduce risk the most
- Use What-If Analysis to forecast risk reduction before making changes
Result: Predictable, Preventable Ransomware
When you break down ransomware by entry point, techniques, and controls, you don’t just detect attacks — you proactively block them.
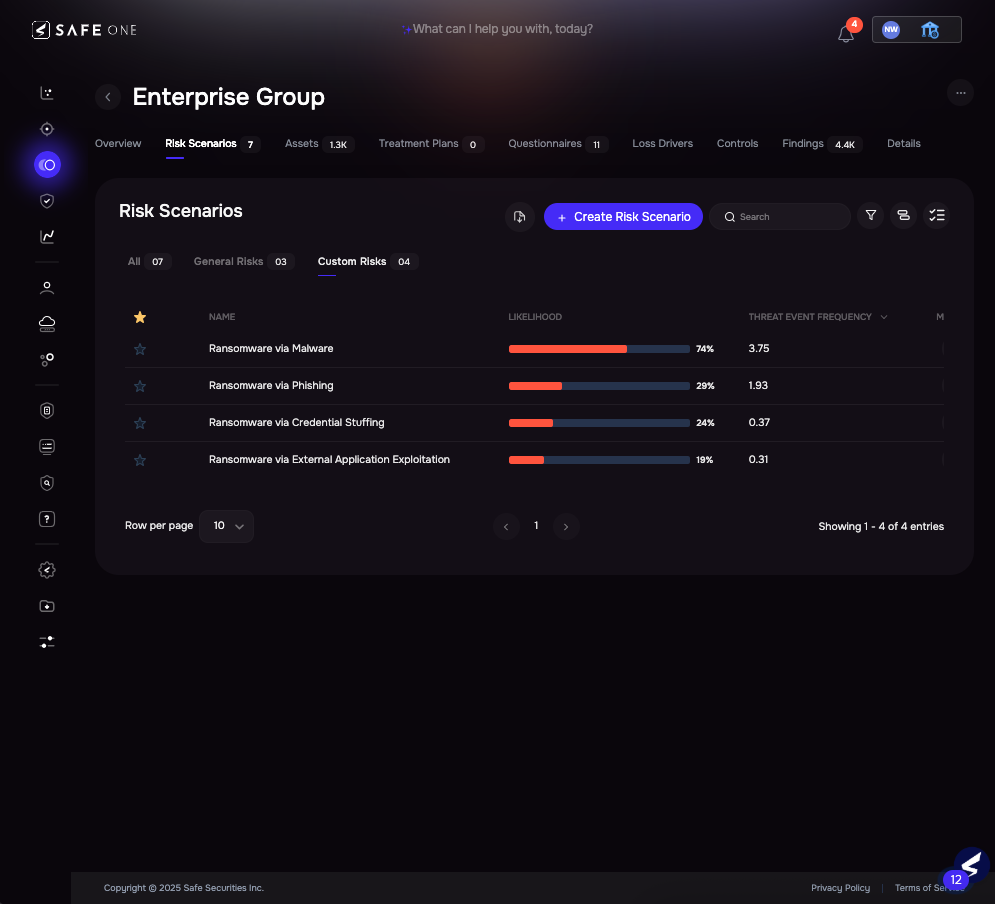
Image 3.2 – Ransomware Risk Scenarios Across IAMs
Once a scenario is created, SAFE provides a detailed analysis of top contributing findings (e.g., exposed Azure assets, missing MFA), control maturity gaps amplifying the likelihood, and Loss drivers, including annualized financial impact.
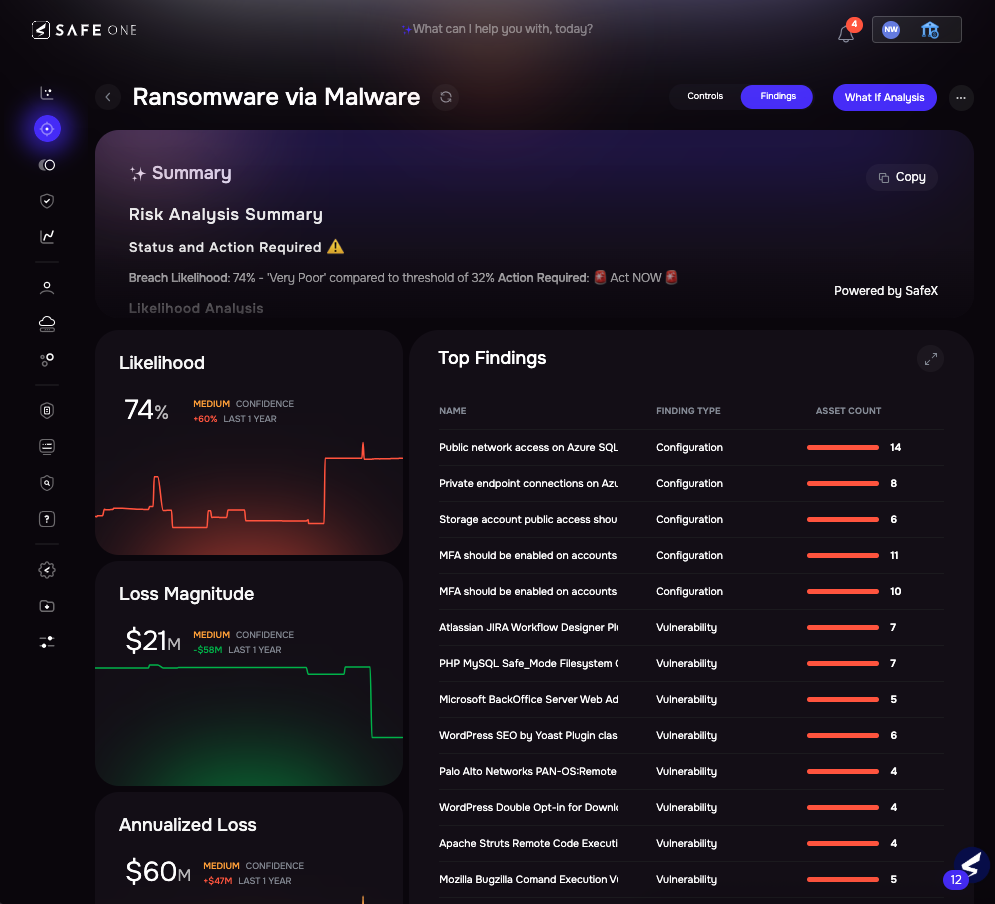
Image 3.3 – Ransomware via Malware Risk Scenario – Findings View
To go one step further, SAFE allows you to drill down into the top control gaps contributing to breach likelihood, such as low maturity in Hardened Cloud or User Access Control. It also quantifies the impact of each control, showing how much the likelihood would drop if that control’s maturity were improved from current to target levels.
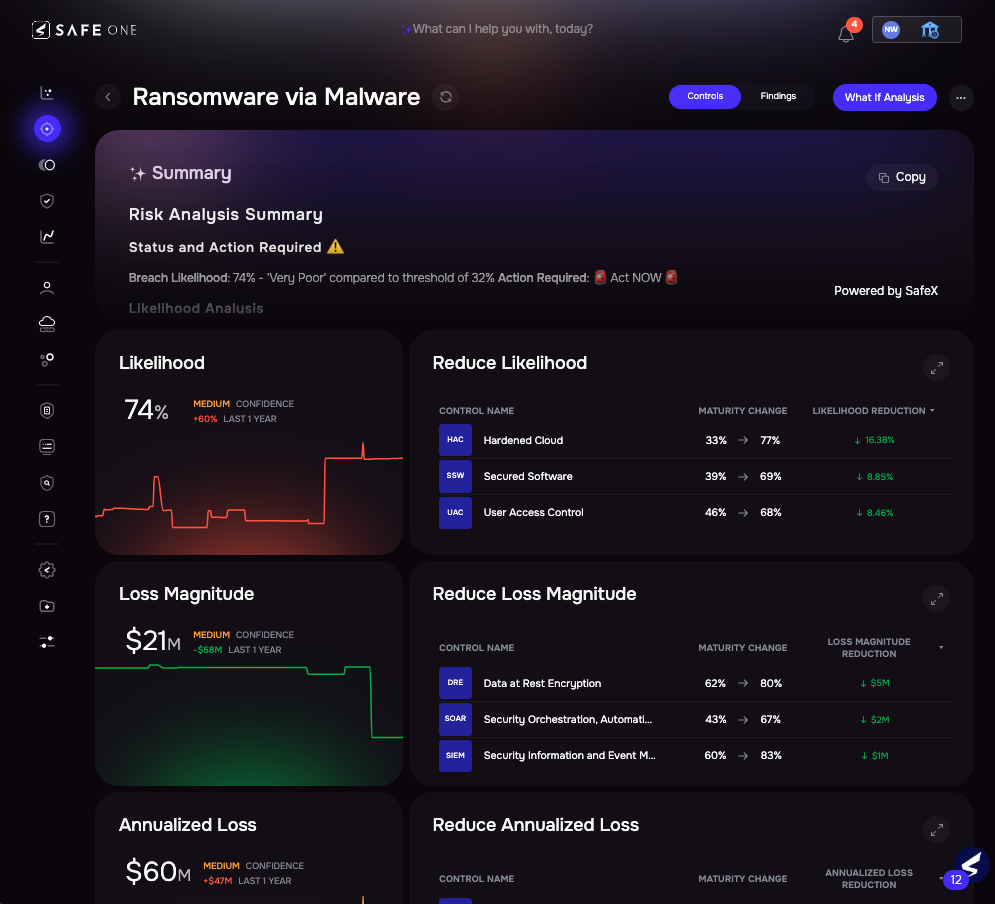
Image 3.4 – Ransomware via Malware Risk Scenario – Controls View
SAFE’s What-If Analysis takes simulation one step further. It allows you to test the impact of specific remediations before you act. Whether enabling MFA, increasing EDR coverage, or patching a vulnerable asset, What-If shows the risk drop in real time.
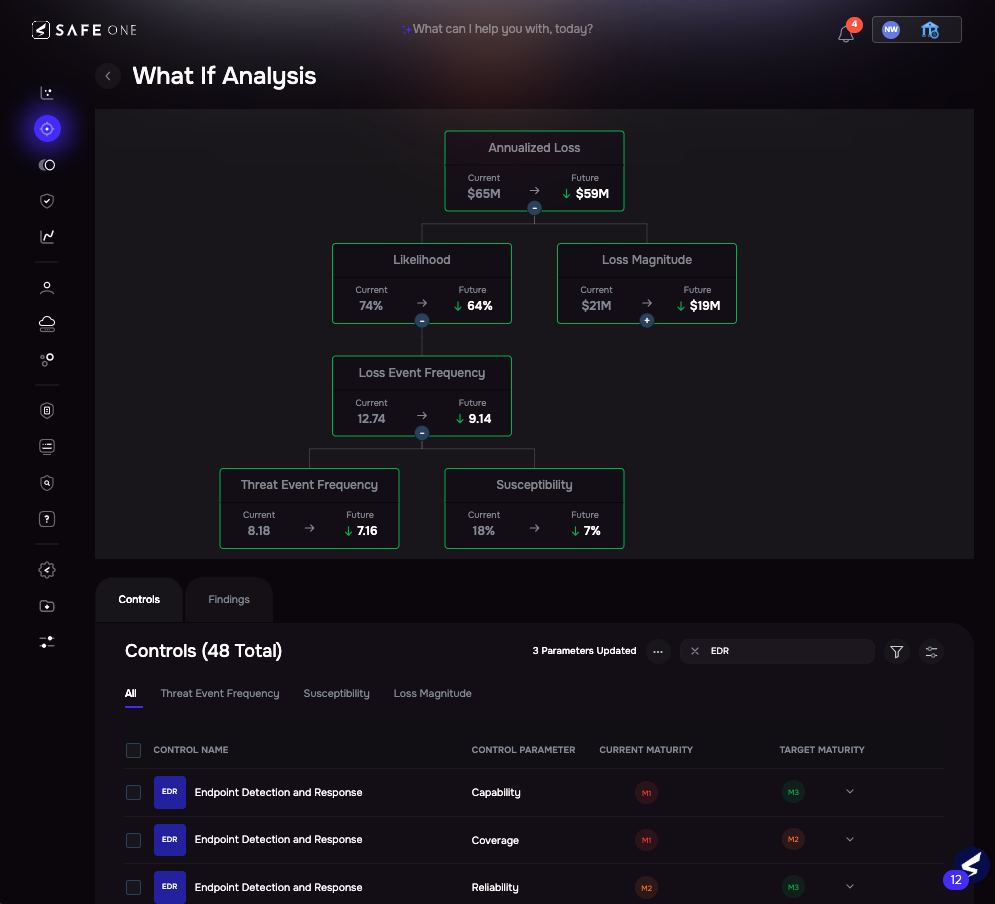
Image 3.5 – What-If Analysis for Ransomware via Malware Risk Scenario
While What-If focuses on a single risk scenario, SAFE also enables Risk Treatment Plans at the group level — aggregating multiple scenarios (e.g., all ransomware paths across an enterprise segment or business unit) into one plan, allowing organizations to:
- Identify common control weaknesses impacting multiple scenarios
- Simulate the cumulative benefit of improving controls across the board
- Prioritize actions that deliver the broadest risk reduction per dollar or effort
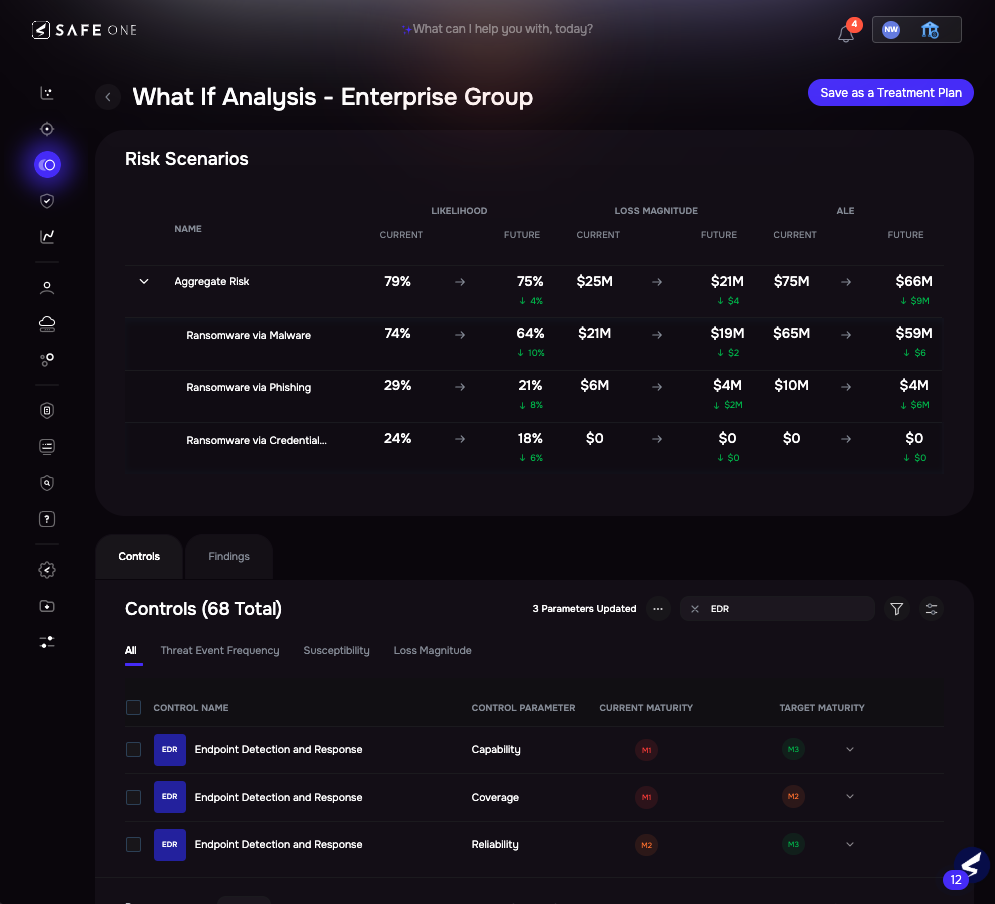
Image 3.6 – Risk Treatment Plan for Ransomware Risk Scenarios
Both What-If and Risk Treatment Plans provide a pre-remediation forecast, so teams can see the payoff of mitigation strategies before investing resources. Whether looking at one attack path or an entire group of assets, SAFE makes ransomware risk reduction measurable and defensible.
SAFE’s risk scenario breach likelihood modeling isn’t just based on internal exposure, findings, or control gaps— it’s continuously powered by live threat telemetry. Behind the scenes, likelihoods are continually updated based on what’s happening in the threat landscape, which brings us to the next layer of intelligence.
From Static Trends to Live Targeting: Threat Center in Action
To make scenario modeling truly dynamic, SAFE powers it with daily threat intelligence telemetry, tracking which attack methods are used by which threat actor across which industries.
This threat intelligence is driven by Threat Event Frequency (TEF) – a dynamic metric that estimates how likely a threat actor is to target a particular industry using a specific IAM. TEF is continuously refreshed using:
- Observed campaigns in the wild
- Confirmed incidents, such as breach disclosures and law enforcement reporting
- Access broker activity on dark web marketplaces (initial access sales)
- TTP shifts in active threat actors, especially ransomware affiliates and malware operators
- Geographic and industry-specific targeting patterns
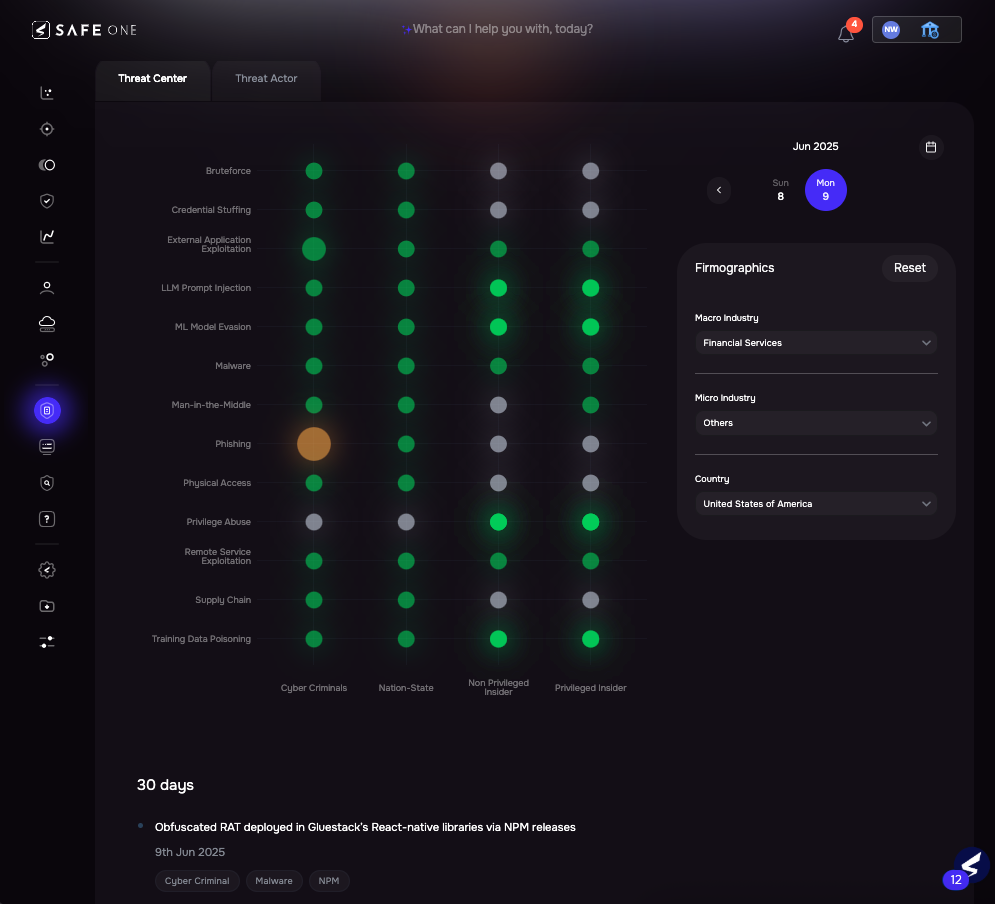
Image 3.7 – Threat Center: TEF Graph
These dynamic TEFs directly influence SAFE’s risk scenarios:
- A spike in phishing activity by cybercriminals targeting your sector will raise the likelihood of phishing-related ransomware scenarios.
- A shift in actor behavior — from malware loaders to credential abuse — will recalibrate scenario scores accordingly.
- Newly reported incidents in your peer industry will update the Threat Event Frequency baseline behind the scenes.
That’s how SAFE ensures you’re not monitoring historical assumptions. Your breach likelihood is always grounded in live threat behavior, not what happened last year.
Section 2: Modeling Credential Stuffing as a Risk Scenario: The Silent Threat Behind 22% of Breaches
Why Credential Stuffing Still Works
Credential abuse is behind 22% of breaches (DBIR 2025). Infostealer malware floods the dark web with valid logins, and reused passwords give attackers easy, quiet entry.
Infostealer malware like RedLine and Raccoon floods dark web markets with valid enterprise credentials. These are often reused across SaaS platforms, third-party access points, and administrative systems. When authentication controls like MFA are missing or inconsistently enforced, a compromised credential can unlock multiple access points across an organization’s extended ecosystem.
Real-World Example: Snowflake Campaign
In 2024, the UNC5537 extortion campaign hit 165+ Snowflake customer accounts — including AT&T, Ticketmaster, and Santander. Attackers used stolen credentials, bypassed weak MFA, exfiltrated data, and extorted victims across misconfigured SaaS environments.
Top ATT&CK Techniques and FAIR-CAM Controls
Credential stuffing isn’t noisy—it’s precise. Threat actors rely on just a few techniques to quietly escalate access across cloud and SaaS environments:
| Commonly used MITRE ATT&CK Techniques | Mapped FAIR-CAM Controls |
|---|---|
| T1078 – Valid Accounts |
|
| T1021 – Remote Services | |
| T1087 – Account Discovery | |
| T1041 – Exfiltration Over C2 Channel | |
| T1567.002 – Exfiltration to Cloud Storage |
Simulating Credential Stuffing Risk in SAFE
The example below reflects a scenario similar to the UNC5537 campaign targeting Snowflake customers, where attackers used stolen credentials to access SaaS environments lacking MFA and IP restrictions.
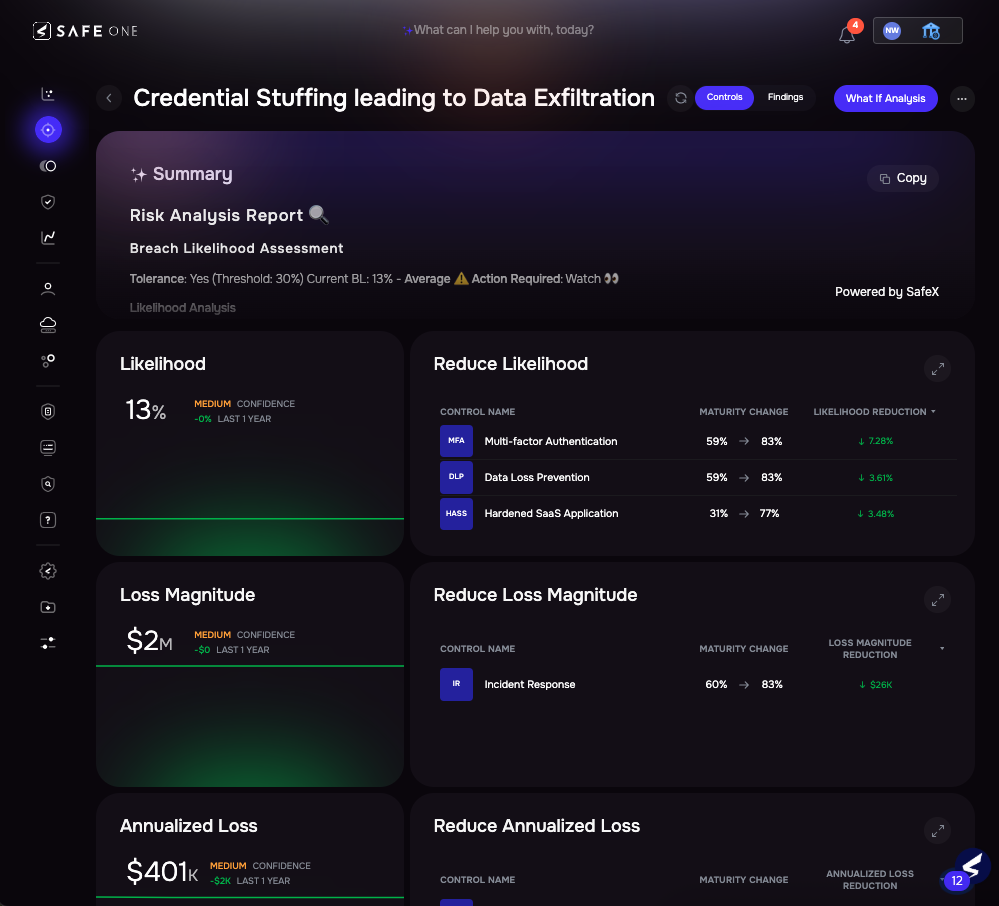
Image 4.1 – Credential Stuffing Leading to Data Exfiltration Risk Scenario
Section 3: Rethinking Third-Party Risk: From Static Questionnaires to AI-Driven Monitoring
The Verizon DBIR 2025 highlights that nearly 30% of breaches involve third-party components—from SaaS platforms and managed service providers to software vendors and data processors. This trend reflects how attackers increasingly exploit indirect access points, making third-party risk one of modern enterprises’ most critical and under-monitored exposure surfaces.
Traditional third-party risk management relies on static assessments, spreadsheet-driven workflows, and periodic reviews that miss rapidly evolving threats. By the time an issue is discovered, it’s usually too late.
SAFE’s AI-Powered TPRM: Real-Time, Not Point-in-Time
SAFE transforms this reactive model into a proactive, AI agent–orchestrated process. The TPRM module automates the entire third-party lifecycle—from onboarding to breach alerting—so that vendor risk profiles are always up-to-date without manual overhead.
SAFE’s AI agents handle:
- Automated vendor onboarding and classification – zero manual intake
- Continuous discovery of external attack surfaces and shadow vendors
- Automated due diligence: security questionnaires, evidence validation, and control checks
- Real-time monitoring of vendor exposure, including breach history and fourth-party risks
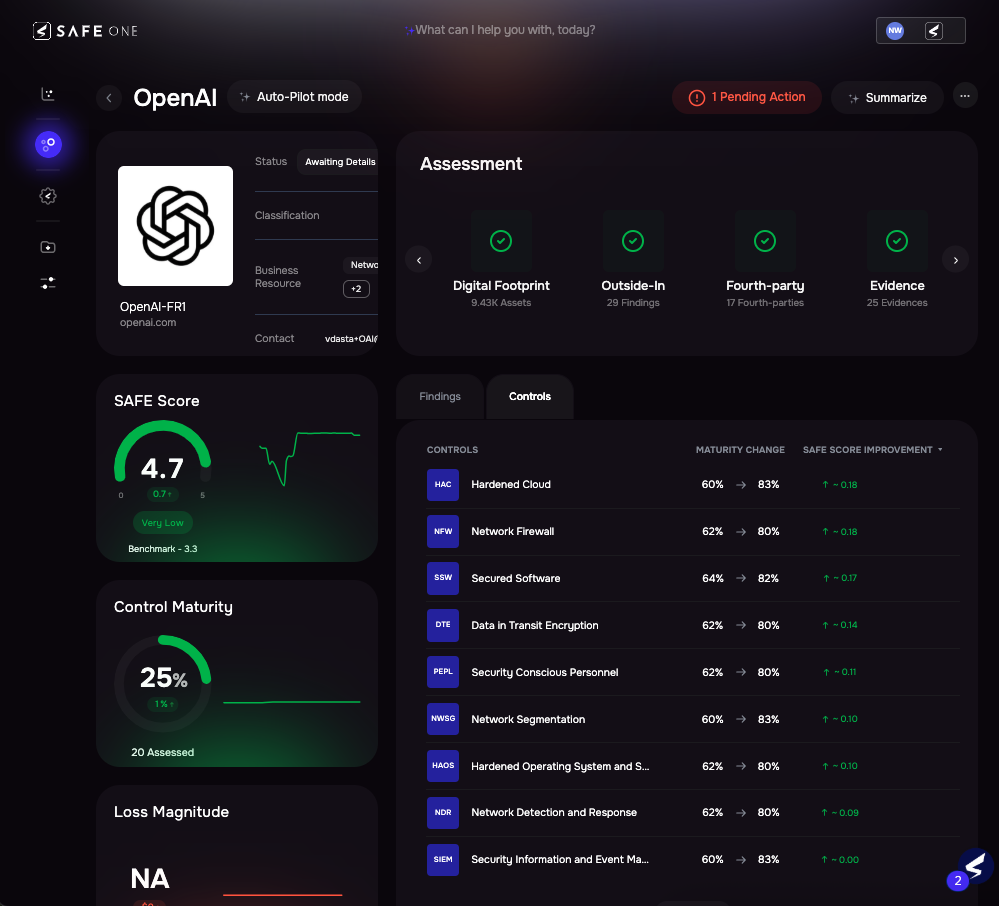
Image 5.1 – SAFE’s AI-Powered Third-Party Risk Profile View
This unified approach eliminates blind spots and ensures that third-party risks are prioritized based on threat exposure, not subjective scores or outdated documents.
Breach Exposure? Get Notified, Instantly
Why wait for public fallout? SAFE monitors breach disclosures, ransomware leaks, and dark web signals – flagging real-time third-party exposures before they become your next risk.
In the example below, SAFE detects three breach exposure instances tied to a vendor. This data is surfaced within their risk profile, automatically recalculating their SAFE Score and alerting your team to reassess connected risk scenarios.
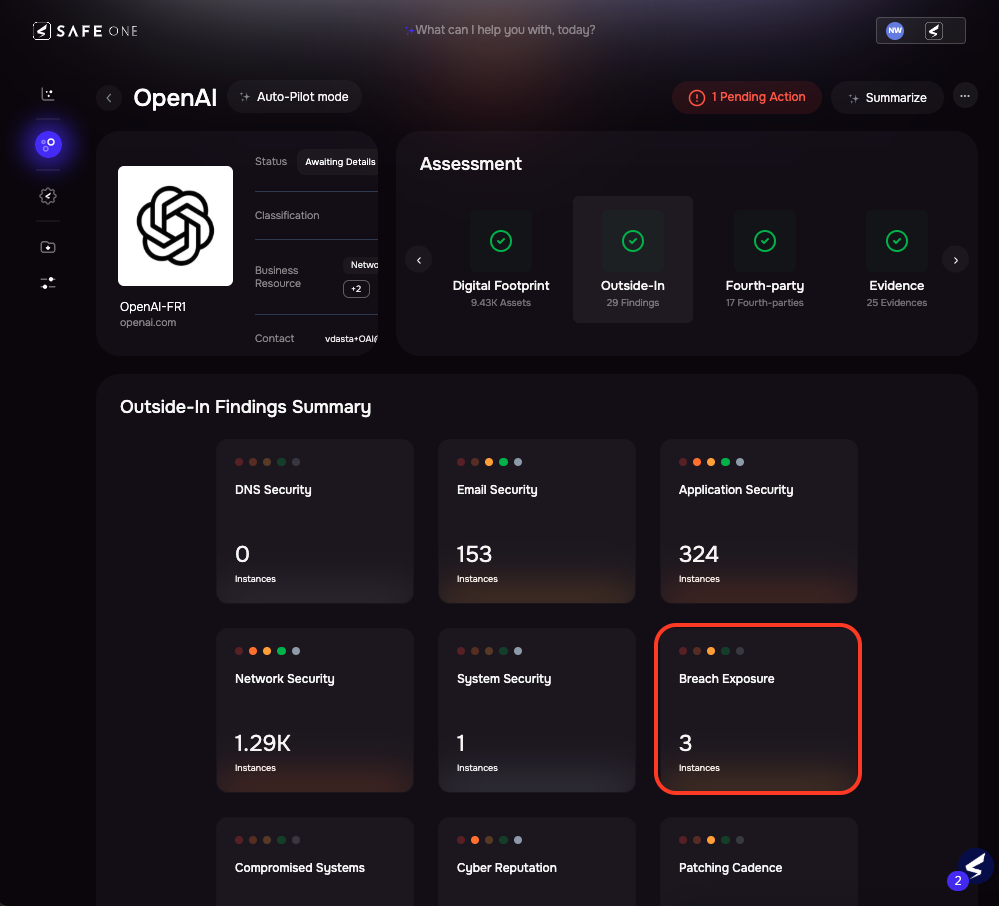
Image 5.2 – Outside-In Findings, Including Third-Party Breach Exposure
This AI-driven, outside-in approach transforms TPRM from a compliance checkbox into a live operational risk function—so security teams can detect inherited risks early, simulate their downstream impact, and take action before an attacker’s access becomes enterprise exposure.
Conclusion: From Yearly Reports to Daily Risk Readiness
The Verizon DBIR 2025 is an essential snapshot of how attackers succeed: which methods dominate, how ransomware adapts, and where third-party risk hides in plain sight.
SAFE brings static DBIR insights into live, measurable risk scenarios you can act on —every single day.
Whether you’re validating ransomware controls, tightening identity hygiene, or watching for vendor leaks, SAFE shows you exactly where to focus, what to fix, and how much risk you eliminate.
Key Takeaways
- Model real attack paths: Don’t just read about breaches — simulate them in your environment.
- Quantify live risk: Know exactly how likely each threat is, based on today’s threat signals.
- Treat risk proactively: Fix the right controls first and see your breach likelihood drop before you spend budget.
- Turn third-party risk from static questionnaires into a living, continuously monitored part of your security posture.
Because in today’s threat landscape, breach trends don’t wait, and neither should your risk model.
See continuous cyber risk management in action – schedule your demo of the SAFE One platform.