Key Risk Indicators for Cyber Risk Quantification: Examples CISOs Actually Use
Attack surface and vulnerability exposure, third party and supply chain risk, patch management metrics, and more KRIs.
Imagine a CISO preparing for a board meeting, tasked with explaining the organization’s cyber risk in clear, actionable terms. Instead of vague threat levels or technical jargon, the board wants to see specific, measurable indicators that predict potential losses and justify security investments.
Key risk indicators (KRIs) are predictive metrics that forecast the likelihood and impact of cyber incidents before they occur, enabling proactive risk management. Unlike traditional security metrics that count vulnerabilities or log events, KRIs translate technical exposures into financial terms that business leaders understand—bridging the gap between IT operations and executive decision-making.
This article provides specific KRI examples that CISOs use to measure, monitor, and communicate cyber risk in dollars and cents, along with practical guidance for implementing thresholds, automating monitoring, and building dashboards that make cyber risk as transparent as any other enterprise risk.
What Are Key Risk Indicators KRIs and Their Meaning
Key Risk Indicators (KRIs) are predictive metrics that signal increasing risk exposure before incidents occur. Unlike security metrics that measure what already happened—like the number of incidents detected last quarter—KRIs measure conditions that could lead to future losses, giving security teams lead time to intervene.
Think of KRIs as the check engine light in your car. The light doesn’t mean your engine has failed—it means conditions exist that could lead to failure if left unaddressed. In cybersecurity, a KRI might be the number of internet-facing systems with unpatched critical vulnerabilities. The higher this number climbs, the greater the probability of breach and the more urgent the need for remediation.
The key difference between KRIs and other security metrics comes down to prediction versus detection. A KRI answers: “What conditions exist right now that make a costly cyber incident more likely?” Instead of reporting “347 critical vulnerabilities detected,” a risk-based approach reports “estimated $2.3M in potential loss exposure from exploitable vulnerabilities on revenue-generating systems.” This translation from technical finding to financial impact is what makes KRIs essential for cyber risk quantification.
In frameworks like FAIR (Factor Analysis of Information Risk), KRIs specifically measure factors that influence both the likelihood and magnitude of financial loss from cyber events. This makes cyber risk measurable, comparable, and manageable like any other enterprise risk—credit risk, market risk, or operational risk.
Key Risk Indicators vs Key Performance Indicators In Cyber Security
Many organizations confuse key risk indicators with key performance indicators, leading to dashboards full of activity metrics that don’t actually measure risk reduction. The distinction matters because you can have excellent KPIs—high patch rates, frequent vulnerability scans, complete security awareness training—while still having unacceptable risk levels if those activities aren’t targeting the right exposures.
KPIs measure how well security programs are executing. They track the performance of controls and processes: percentage of systems scanned, mean time to deploy patches, number of phishing simulations completed. KRIs measure exposure and potential loss. They track the likelihood and impact of risk events: number of exploitable vulnerabilities on critical assets, count of vendors with access to sensitive data who have poor security posture, mean time to detect and contain incidents.
Here’s a practical comparison:
| Metric Type | What It Measures | Example |
| KRI (Vulnerability Management) | Exposure to exploitable vulnerabilities | Number of internet-facing systems with critical unpatched vulnerabilities |
| KPI (Vulnerability Management) | Efficiency of vulnerability scanning | Percentage of assets scanned weekly |
| KRI (Patch Management) | Risk from unpatched systems | Mean time to patch critical vulnerabilities |
| KPI (Patch Management) | Patch process performance | Percentage of patches applied within SLA |
| KRI (Third-Party Risk) | Vendor exposure to cyber threats | Number of critical vendors with unresolved high-severity issues |
| KPI (Third-Party Risk) | Vendor assessment completion | Percentage of vendors with completed security questionnaires |
Both types of metrics are necessary for a complete picture. KPIs tell you if you’re doing security work efficiently. KRIs tell you if that work is actually reducing risk. A mature security program monitors both—using KPIs to optimize operations and KRIs to drive strategic risk decisions.
Examples of Key Risk Indicators for Cyber Risk Quantification
The following five KRI categories represent the core indicators that CISOs use for financial cyber risk quantification. These aren’t compliance metrics or technical counts—they’re risk indicators grounded in frameworks like FAIR that enable organizations to calculate potential losses in monetary terms.
1. Attack Surface and Vulnerability Exposure
Attack surface refers to all points where an unauthorized user could enter a system or network—internet-facing assets, cloud environments, remote access points, connected devices. A larger, more exposed attack surface increases the probability that threat actors will find and exploit entry points.
The most actionable KRI in this category is the count of internet-facing assets with known critical vulnerabilities (CVE score 9.0 or higher). This metric combines exposure—the asset is reachable from the internet—with exploitability—a critical vulnerability exists—to identify your highest-probability attack vectors. When this number rises above your risk threshold, it triggers immediate remediation workflows.
CISOs track several related indicators:
- Percentage of attack surface with active exploitation observed in threat intelligence
- Count of shadow IT assets discovered outside the IT inventory
- Number of exposed credentials found on dark web or breach databases
- Mean time to discover new assets added to the attack surface
The goal isn’t to eliminate all vulnerabilities—that’s impossible—but to understand which exposures create the highest probability of successful attack and prioritize remediation accordingly. SAFE CTEM unifies exposure data from tools like Tenable, Qualys, Rapid7, Wiz, and Prisma Cloud to create a single view of attack surface risk, prioritizing vulnerabilities based on exploitability, business criticality, and control coverage.
2. Third Party And Supply Chain Risk
Modern enterprises depend on hundreds or thousands of vendors, each representing a potential entry point for attackers. The breaches at SolarWinds, Kaseya, and MOVEit demonstrated how a single compromised vendor can cascade into thousands of downstream victims.
Third-party risk in this context is the cyber risk exposure inherited from vendors, suppliers, and partners who have access to your systems, data, or business processes. Each critical vendor—those with access to sensitive data or systems—represents a potential loss pathway. The challenge is that you don’t control vendor security practices, yet you inherit the consequences of their failures.
The most critical KRI here is the number of critical vendors with cybersecurity ratings below your acceptable threshold or with unresolved high-severity security issues. This metric identifies vendors who both have significant access and demonstrate poor security posture—the combination that creates material risk.
Other key indicators include:
- Percentage of vendors without current security assessments
- Number of vendors with access to crown jewel assets lacking continuous monitoring
- Mean time to detect and respond to vendor security incidents
Traditional vendor risk management focuses on compliance—collecting security questionnaires and checking boxes. Risk-based vendor management, enabled by KRIs, focuses on actual financial exposure. By assessing vendor security posture and access privileges, CISOs can estimate the probability of third-party-originated incidents and model potential losses from data breaches, business interruption, or regulatory penalties. SAFE TPRM automates vendor assessment and continuous monitoring, prioritizing vendors based on actual cybersecurity risk and potential financial loss rather than static compliance scores.
3. Patch Management And Configuration Metrics
Unpatched vulnerabilities and misconfigurations are the most common attack vectors exploited in successful breaches. The time systems remain vulnerable after patches are available directly correlates with exploitation probability—and attackers are increasingly fast at weaponizing newly disclosed vulnerabilities.
The most predictive KRI in this category is mean time to patch critical vulnerabilities across your enterprise. This metric captures both your patch process efficiency and your actual window of exposure. When mean time to patch exceeds the time it takes attackers to develop and deploy exploits—often measured in days or even hours for critical vulnerabilities—your probability of successful attack increases substantially.
Attackers don’t exploit all vulnerabilities equally. They target the ones that are easiest to exploit, most likely to succeed, and most valuable to compromise. A critical vulnerability on an internet-facing server running a business-critical application represents far more risk than the same vulnerability on an isolated internal system.
Additional KRIs in this category include:
- Number of systems running end-of-life software without compensating controls
- Count of critical misconfigurations detected in cloud environments
- Percentage of systems deviating from CIS benchmarks or security baselines
- Number of exploitable vulnerabilities with active proof-of-concept code available
Rather than treating all vulnerabilities equally, KRIs help prioritize remediation based on exploitability, business criticality, and actual threat intelligence about what attackers are targeting right now.
4. Incident Response And Recovery Times
Incident response and recovery metrics might seem reactive—measuring what happens after an attack succeeds—but they’re actually predictive of loss magnitude. How quickly you detect and contain incidents directly determines financial impact.
The most critical KRI here is mean time to detect (MTTD) security incidents. Organizations with MTTD measured in months rather than days face dramatically higher breach costs. Detection time is a direct multiplier on loss magnitude.
Mean time to contain and remediate incidents is equally important. Once you’ve detected an incident, how quickly can you stop the bleeding—isolate affected systems, revoke compromised credentials, block malicious traffic? The containment window determines how much damage the attacker can inflict before you shut them down.
Other indicators in this category include:
- Percentage of incidents detected by internal controls versus external notification
- Recovery time objective (RTO) for critical business systems
- Number of business-critical systems lacking tested backup and recovery procedures
In FAIR terminology, these metrics influence secondary loss magnitude—the indirect costs from business interruption, response activities, and reputation damage. Organizations with mature incident response capabilities—reflected in low MTTD and fast containment—can limit losses even when preventive controls fail.
5. Financial Impact and Value at Risk
Financial impact and Value at Risk (VaR) represent the ultimate KRI category, synthesizing all other indicators into monetary terms. While technical KRIs measure exposure and likelihood, financial KRIs translate cyber risk into the language of business: dollars at risk.
Cyber Value at Risk is defined as the maximum expected loss from cyber events over a given time period at a specified confidence level. For example: “We have 95% confidence that our cyber losses won’t exceed $10 million annually.” This metric makes cyber risk directly comparable to market risk, credit risk, and operational risk—all of which use VaR as a standard measure.
The most comprehensive KRI in this category is Cyber VaR at your organization’s chosen confidence level (typically 95% or 99%). When cyber VaR exceeds your stated risk appetite—the amount of risk leadership is willing to accept—it triggers strategic decisions about control investments or business process changes.
Other financial KRIs include:
- Expected annual loss from cyber events (the mean of your loss distribution)
- Maximum probable loss for specific scenarios like ransomware, data breach, or business interruption
- Financial exposure per business unit or asset class
- Ratio of cyber insurance coverage to calculated VaR
CISOs calculate financial KRIs by aggregating technical indicators through probabilistic models, often using Monte Carlo simulations based on FAIR methodology. These calculations factor in threat frequency, vulnerability, asset value, and control effectiveness to produce loss distributions—not single-point estimates, but ranges of possible outcomes with associated probabilities. SAFE CRQ automatically aggregates data from over 100 security tools and calculates financial risk using FAIR standards, producing board-ready reports that translate technical security posture into expected financial losses.
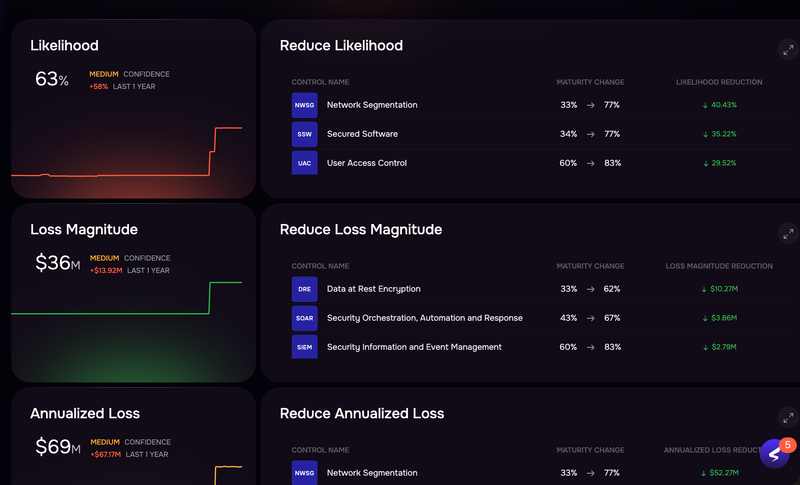
Detail of dashboard, SAFE One risk platform
Risk Management Performance Indicators and KRI Dashboard Setup
KRIs only deliver value when monitored consistently and communicated effectively—which requires thoughtful dashboard design. A KRI dashboard serves as a single pane of glass for cyber risk posture, showing current risk levels, trends over time, and threshold breaches that require attention.
Effective dashboards include several key elements:
- Executive summary view: Displays your top three to five KRIs with red/yellow/green status against risk appetite thresholds
- Trend analysis: Shows KRI movement over time to demonstrate whether risk is increasing or decreasing
- Drill-down capability: Enables users to investigate root causes behind KRI changes
- Financial context: Presents risk indicators alongside monetary impact when possible
- Actionable insights: Links elevated KRIs to specific remediation recommendations
Dashboards update in near-real-time by integrating with security tools, vulnerability scanners, and risk platforms. They’re tailored to the audience—CISOs need operational detail about which systems are exposed and what remediation actions are in flight, while boards need strategic summary showing overall risk trajectory and how it compares to risk appetite.
Steps to Implement KRI Risk Indicator Thresholds and Monitoring
Identifying relevant KRIs is only the first step—organizations also establish meaningful thresholds that trigger action and implement continuous monitoring to track changes. Without clear thresholds and monitoring processes, KRIs become just more data points rather than actionable decision triggers.
1. Define Thresholds For Each Risk Indicator
Thresholds transform KRIs from measurements into decision triggers—they define the point at which risk becomes unacceptable and requires action. Setting effective thresholds involves several considerations.
First, benchmark against peers and industry standards for context. Research what risk levels similar organizations in your industry consider acceptable. Second, align with your organization’s stated risk appetite—the amount of risk leadership is willing to accept in pursuit of business objectives. Third, use tiered alerts with yellow (warning) and red (critical) thresholds rather than single cutoffs.
For example, for the KRI “number of internet-facing systems with critical unpatched vulnerabilities,” a threshold structure might be: Green equals zero to five systems (acceptable risk), Yellow equals six to fifteen systems (requiring a 30-day remediation plan), Red equals sixteen or more systems (requiring immediate executive briefing). The specific numbers depend on your organization’s size, industry, and risk tolerance.
Thresholds aren’t static. They’re reviewed quarterly and adjusted based on changing threat landscape, business priorities, and organizational capabilities.
2. Automate Data Collection and Alerts
Manual KRI tracking doesn’t scale and introduces delays that undermine the predictive value of risk indicators—automation is essential for timely risk visibility. Modern cyber risk platforms aggregate data from dozens of security tools, calculate KRIs automatically, and provide real-time dashboards and alerts.
Effective automation includes several components:
- Tool integration: Connects security tools, vulnerability scanners, asset inventories, and risk platforms via APIs
- Scheduled updates: Configures automatic data collection at appropriate intervals
- Threshold-based alerts: Notifies stakeholders when KRIs breach yellow or red thresholds
- Workflow triggers: Automatically creates tickets or initiates remediation workflows when thresholds are exceeded
For example, when the KRI “number of critical vendors with unresolved high-severity issues” exceeds the red threshold, the system automatically creates a Jira ticket assigned to the third-party risk team, sends a Slack alert to the CISO, and schedules a risk review meeting within 48 hours. SAFE’s Agentic AI system uses over 25 specialized agents to autonomously perform data ingestion, control validation, and exposure correlation, enabling zero-effort KRI automation.
Key Risk Indicators, Operational Risk and Third Party Exposure
Cyber risk is a subset of operational risk—the risk of loss from inadequate or failed internal processes, people, systems, or external events. Operational risk KRIs in cybersecurity focus on systemic weaknesses and process failures that create vulnerability, rather than specific technical flaws.
Operational risk KRIs measure things like percentage of critical roles lacking adequate backup or succession planning, number of business processes dependent on single points of failure, and percentage of privileged users without multi-factor authentication. These aren’t technical vulnerabilities you can patch—they’re organizational weaknesses that require process improvements and governance changes.
Third parties introduce operational risk through dependencies on their processes, personnel, and systems. The CrowdStrike outage of 2024 demonstrated how a single vendor’s operational failure can cascade across thousands of organizations—airlines canceled flights, hospitals postponed procedures, and banks experienced service disruptions, all because of one vendor’s flawed update process.
While vulnerability counts measure technical weaknesses, operational KRIs measure organizational resilience and process maturity. Together, they provide a complete picture of cyber risk—both the probability of attacks succeeding and the organization’s ability to limit damage when they do.
Strengthening Cyber Resilience with Actionable KRIs
Key risk indicators transform cybersecurity from a technical function into a measurable business discipline—they make cyber risk visible, quantifiable, and manageable. Effective KRIs answer the questions every CISO faces: How much risk do we have? Where is it concentrated? What actions will reduce it most cost-effectively?
Traditional cybersecurity focuses on implementing controls and achieving compliance frameworks—measuring inputs and activities. Risk-based cybersecurity, enabled by KRIs, focuses on reducing the probability and magnitude of financial losses—measuring outcomes. This approach allows security leaders to demonstrate ROI, optimize spending, and communicate effectively with boards and executives who think in terms of risk and return.
As cyber threats grow more sophisticated and regulatory expectations increase, organizations gain real-time visibility into cyber risk expressed in business terms through KRIs integrated with quantification platforms.
Organizations seeking to implement financial cyber risk quantification and automate KRI monitoring can request a demo of the SAFE Platform to see how Fortune 500 enterprises measure, manage, and mitigate cyber risk in real time.
FAQs about Key Risk Indicators Examples
What is the difference between a risk indicator and a key risk indicator?
A risk indicator is any metric that signals potential risk, while a key risk indicator is critical enough to warrant executive attention and regular monitoring. KRIs are selected based on their strong correlation with financial loss and their ability to trigger strategic risk decisions, not just operational responses.
How do key risk indicators integrate with cybersecurity frameworks like NIST or MITRE?
KRIs complement frameworks by measuring the effectiveness of controls and processes those frameworks prescribe. For example, you might track the percentage of NIST CSF controls implemented and their measured effectiveness, or monitor your coverage against MITRE ATT&CK techniques observed in current threat intelligence. Frameworks tell you what to do; KRIs tell you whether doing those things is actually reducing risk.
Which key risk indicator is most critical for early detection of cyber threats?
Mean time to detect combined with attack surface exposure provides the earliest warning. Specifically, monitoring for exploitable vulnerabilities on internet-facing assets cross-referenced with active threat intelligence about vulnerabilities under exploitation identifies imminent threats before they materialize into incidents.
How often should organizations review and update their KRI thresholds?
Quarterly threshold reviews are recommended as a baseline, with immediate reviews triggered by significant changes. Major acquisitions, new regulatory requirements, substantial shifts in threat landscape, or material incidents all warrant threshold reassessment. Thresholds evolve as organizational security maturity improves and business risk appetite changes.
Schedule a Demo with SAFE – The only Agentic AI-driven Continuous Cyber Risk Management platform.