Measuring Cybersecurity ROI: A Framework For 2026 Decision-Makers
How to address the bottom-line question for CISOs: budget justification
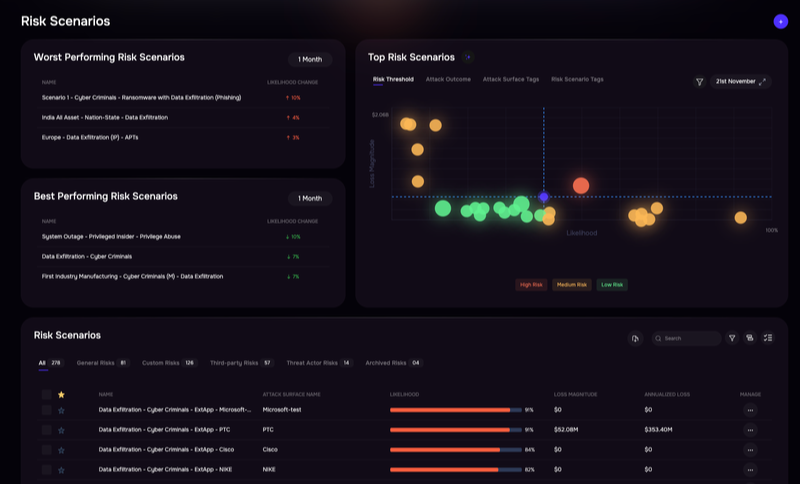
SAFE One platform
In this blog post, we discuss:
- What Is Cybersecurity ROI And Why Does It Matter?
- Key Metrics And Frameworks for ROI in Cyber Security
- Common Challenges In Measuring Security ROI
- Practical Steps To Calculate IT Security ROI
- Proving Cyber Security ROI To Executives And Boards
- Future-Focused Cybersecurity ROI Calculator And Automation
- Driving Risk Reduction And Business Value
Security leaders face an impossible question: how do you prove the value of disasters that never happened? A $2 million investment in endpoint detection looks expensive until you consider the $15 million ransomware attack it prevented—except you can’t point to that attack because it didn’t occur.
This paradox explains why CISOs struggle to justify budgets while CFOs demand measurable returns on every dollar spent. The solution lies in frameworks that quantify cyber risk in financial terms, calculate expected losses with and without security controls, and translate technical metrics into business language that resonates with executives and boards.
What Is Cybersecurity ROI And Why Does It Matter?
Cybersecurity ROI, or Return on Security Investment (ROSI), measures the financial value of security spending by calculating the monetary benefits—primarily from avoided losses—against the costs. The calculation takes the total annual losses avoided from breaches, fines, and downtime, subtracts the cost of the security investment, then divides by that investment cost. Unlike traditional ROI that measures revenue generated, cybersecurity ROI quantifies risk reduction and loss prevention in cold, hard cash.
Here’s the thing: Most executives think about investments in terms of what they gain, not what they avoid. A new product line generates $5 million in revenue—that’s easy to see and celebrate. A security control that prevents a breach? That’s invisible until something goes wrong. This creates a fundamental challenge for CISOs trying to justify budget requests to CFOs and boards who are accustomed to seeing returns in profit and loss statements, not in disasters that didn’t happen.
The standard approach to measuring security value breaks down because you’re trying to quantify events that never occurred. The breach you blocked, the ransomware you stopped, the data you protected—none of these show up on a balance sheet. This is why security professionals increasingly turn to specialized models or frameworks like FAIR (Factor Analysis of Information Risk) that account for probability and impact of cyber events rather than direct revenue generation.
Learn more: Calculating Risk with the SAFE Risk Management Platform
Key Metrics And Frameworks for ROI in Cyber Security
Several established frameworks help organizations move beyond guesswork and put actual numbers on security investments.
FAIR And Gordon Loeb
The FAIR (Factor Analysis of Information Risk) model breaks down cyber risk into two components: how often something bad might happen (loss event frequency) and how bad it would be if it did (loss magnitude). Think of it like car insurance—insurers calculate premiums based on accident probability and average claim costs. FAIR applies this same logic to cyber risk, allowing organizations to calculate expected annual loss for specific scenarios and compare different ways to reduce that loss.

FAIR Model Automation, SAFE One platform
SAFE is the Technical Adviser to the FAIR Institute, the home of the FAIR standard. The SAFE One risk management platform automates FAIR risk analysis.
The Gordon-Loeb model offers a complementary perspective with its “37% rule.” This suggests organizations can optimize security spending by investing up to 37% of the expected loss in protecting an asset. If a data breach affecting customer records would cost $10 million, Gordon-Loeb says spending up to $3.7 million on controls to protect that data makes economic sense. While this percentage serves as a theoretical benchmark rather than a rigid prescription, it provides a useful sanity check for evaluating whether a proposed security investment pencils out.
Annualized Loss Exposure
Annualized Loss Exposure (ALE) calculates the expected monetary loss for an asset over a year by multiplying Single Loss Expectancy (SLE)—the cost of one incident—by Annualized Rate of Occurrence (ARO)—how many times that incident is likely to happen. The formula is straightforward: ALE = SLE × ARO.
Here’s a concrete example: a ransomware attack would cost your organization $500,000 (SLE) and industry data suggests a 20% chance of experiencing one this year (ARO of 0.2). Your ALE is $100,000. Now you can evaluate whether a $60,000 investment in endpoint detection would be worth it if it reduces your ransomware ALE from $100,000 to $20,000. The math starts to make sense.
Return On Security Investment
Return on Security Investment (ROSI) adapts traditional ROI formulas for security spending. The formula is: ROSI = (Risk Exposure × Risk Mitigation Percentage – Cost of Solution) ÷ Cost of Solution.
Consider a company facing $2 million in annual risk exposure from phishing attacks. A security awareness training program costing $150,000 reduces successful phishing by 70%. The ROSI calculation would be: ($2,000,000 × 0.70 – $150,000) ÷ $150,000 = 8.33, or 833%. The challenge lies in accurately estimating that 70% risk reduction figure, which requires looking at actual control effectiveness data rather than optimistic vendor claims.
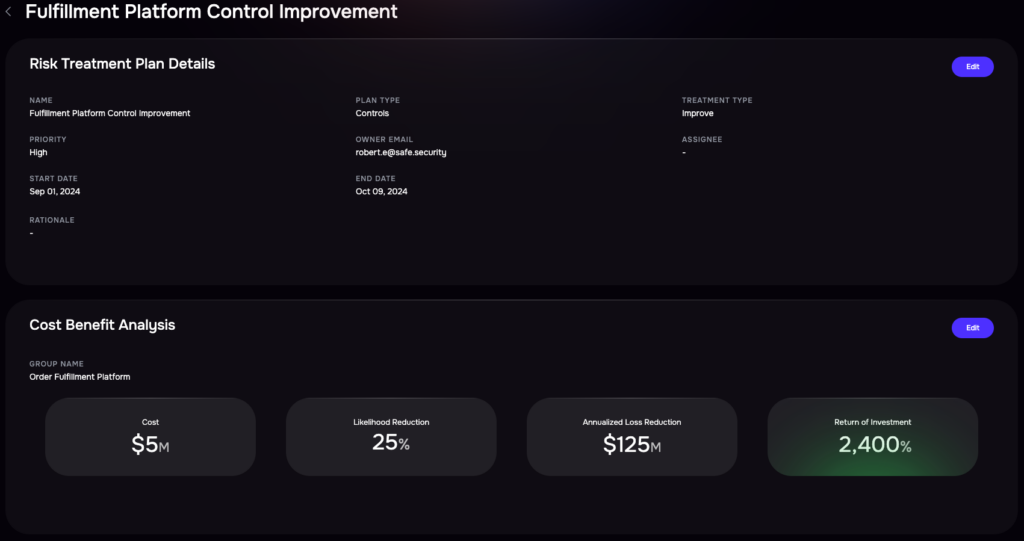
ROI calculation, SAFE One platform
Common Challenges In Measuring Security ROI
The fundamental challenge in measuring IT security ROI is what economists call the counterfactual problem: you’re trying to quantify events that didn’t occur because your security controls prevented them. Unlike a marketing campaign where you can track leads generated or a manufacturing investment where you can measure productivity gains, security value manifests as an absence—the breach that never happened, the ransomware that never encrypted your files.
Attribution poses another hurdle. When your organization goes breach-free for a year, was it because of your excellent security controls, or because attackers simply didn’t target you? If you deploy a new SIEM and detect three incidents, did the SIEM create value by finding threats, or did it just make visible what was already happening? Isolating the specific impact of individual security investments from the broader security program and external threat landscape requires sophisticated analysis.
Data limitations constrain even rigorous ROI calculations. Many organizations lack historical incident data to estimate loss frequency and magnitude accurately. Security tools often generate siloed, inconsistent metrics that don’t translate easily into financial terms. Industry benchmarks provide useful reference points but may not reflect your organization’s unique risk profile, threat exposure, or control environment.
The solution lies in transparency about methodology, conservative assumptions, and continuous refinement as new data becomes available. Organizations that acknowledge uncertainty while still providing data-driven estimates earn more credibility than those claiming false precision or falling back on fear-based arguments.
Learn more: SAFE CRQ – Autonomous Cyber Risk Quantification
Practical Steps To Calculate IT Security ROI
A systematic approach to calculating cyber security ROI transforms abstract concepts into actionable analysis.
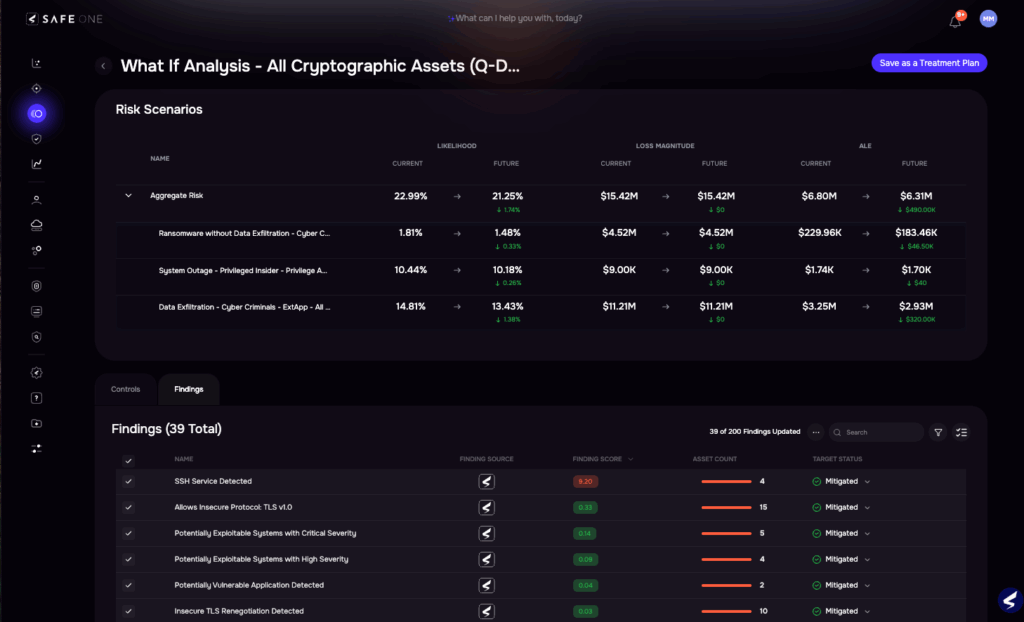
SAFE One platform: Risk Analysis by Assets
1. Identify Assets And Threats
Start by inventorying the critical assets that drive business value and would cause significant harm if compromised—customer databases, intellectual property, operational technology systems, payment processing infrastructure, and sensitive employee records. Prioritize assets based on business criticality by asking which systems and data directly support revenue generation, regulatory compliance, and operational continuity.
Next, identify the realistic threats facing each asset class by combining threat intelligence, industry trends, and your organization’s attack surface. A healthcare provider faces different threat priorities than a financial services firm or a manufacturing company. Focus on threats with credible likelihood and material impact rather than exotic scenarios that make for dramatic headlines but rarely materialize.
2. Estimate Probable Financial Losses
Calculate the potential financial impact of each risk scenario by considering multiple cost categories. Direct costs include incident response, forensics, legal fees, regulatory fines, and notification expenses. Indirect costs encompass business disruption, lost productivity, customer churn, and competitive disadvantage. Reputational damage manifests as decreased customer trust, reduced brand value, and increased cost of customer acquisition.
Industry benchmarks provide useful starting points, but adjust figures based on your organization’s size, industry, and specific circumstances. A breach affecting 10,000 customer records costs substantially less than one affecting 10 million records. The financial impact of three days of downtime varies dramatically depending on whether you’re a SaaS provider with paying customers locked out or a professional services firm where employees can work on other projects.
3. Map Security Controls To Risk Reduction
Determine how each security control reduces specific risks by examining both preventive and detective capabilities. A next-generation firewall might block 80% of network-based attacks, while multi-factor authentication reduces account compromise risk by 99%. Security awareness training typically reduces successful phishing by 50-70%, though effectiveness varies based on program quality and reinforcement frequency.
Calculate residual risk—the exposure remaining after controls are applied—to understand what you’re still accepting. No security control delivers 100% protection, and acknowledging residual risk demonstrates sophistication rather than weakness.
4. Calculate Payback Period
The payback period measures how long it takes for cumulative risk reduction to exceed the investment cost. The formula is: Payback Period = Initial Investment ÷ Annual Risk Reduction. If a $300,000 security investment reduces annual expected losses by $150,000, the payback period is two years.
This metric helps prioritize competing security initiatives by identifying which investments deliver value most quickly. Controls with shorter payback periods—high risk reduction at low cost—typically warrant immediate funding, while those with longer payback periods may be deferred or reconsidered.
Proving Cyber Security ROI To Executives And Boards
Translating technical security metrics into business language requires understanding what different stakeholders care about and framing security value in their terms. CFOs focus on financial impact, cost optimization, and return on capital. CEOs prioritize business enablement, competitive advantage, and strategic risk. Board members want to understand material risks, regulatory compliance, and whether management is exercising appropriate oversight.
Start with business outcomes rather than security activities. Instead of reporting “deployed EDR on 5,000 endpoints,” explain “reduced ransomware risk by 60%, protecting $15 million in annual revenue from potential operational disruption.” Replace “achieved 95% patch compliance” with “closed critical vulnerabilities affecting customer payment systems within 48 hours, maintaining PCI compliance and avoiding potential fines up to $500,000 per month.”
Effective communication strategies include:
>>Risk quantification in financial terms:
Present cyber risk as estimated annual loss in dollars, making it directly comparable to other business risks
>>Trend analysis over time:
Show how security investments have reduced risk exposure, improved control effectiveness, or decreased incident frequency
>>Peer benchmarking:
Compare your security posture and spending to industry peers, highlighting areas of strength and gaps requiring attention
>>Scenario analysis:
Illustrate potential business impact through concrete scenarios that executives can visualize
>>Investment portfolio view:
Present security spending as a portfolio of investments with different risk-return profiles
Translation: Technical Metrics → Business Impact
| Technical Metric | Business Translation / Impact |
| Mean Time to Detect (MTTD): 45 minutes | Breaches contained before spreading, limiting loss to ~$50K vs. $2M+ for uncontained incidents. |
| Phishing Simulation Click Rate: 8% | 92% of employees now spot & report phishing, preventing ~$150K per avoided business email compromise. |
| Vulnerability Remediation: 85% within SLA | 2,400 high-risk vulnerabilities closed, preventing ransomware scenarios with $5M+ in downtime & recovery costs. |
| Third-Party Risk Assessments: 200 vendors | Critical risks mitigated at 15 high-access vendors, avoiding potential supply-chain breach costs of ~$8M. |
Future-Focused Cybersecurity ROI Calculator And Automation
Technology is transforming how organizations measure and demonstrate security value, moving from periodic manual assessments to continuous, automated risk quantification.
1. Integrate Real-Time Data Sources
Continuous ROI measurement connects security tools, business systems, and external threat intelligence to provide up-to-date risk calculations that reflect current conditions rather than outdated snapshots. Integration with vulnerability scanners, SIEM platforms, identity systems, and cloud security posture management tools feeds actual control effectiveness data into risk models. Connection to business systems—financial data, customer records, operational metrics—ensures loss magnitude estimates reflect real business value rather than generic assumptions.
A cybersecurity ROI calculator that pulls live data eliminates the time-consuming manual data collection that makes traditional ROI analysis a quarterly exercise rather than an ongoing management tool.
Learn more: SAFE One Platform Integrations Marketplace
2. Apply AI-Driven Risk Models
Artificial intelligence enhances ROI calculations by identifying patterns across vast datasets that humans would miss, predicting which vulnerabilities are most likely to be exploited, and correlating seemingly unrelated indicators to assess actual risk exposure. Machine learning models trained on historical breach data can estimate loss magnitude more accurately than static formulas.
Agentic AI takes this further by autonomously performing key risk tasks—ingesting data from hundreds of security tools, calculating control effectiveness, correlating exposures across enterprise and third-party environments, and generating natural language reports that explain findings in business terms. AI agents operate continuously without additional headcount, scaling risk quantification capabilities far beyond what manual processes could achieve.
Learn more about Agentic AI for cybersecurity
3. Automate Reporting Dashboards
Effective ROI dashboards present multiple views tailored to different audiences—technical details for security teams, risk trends for executives, compliance status for auditors, and investment performance for boards. Automation eliminates the manual effort of collecting data, building presentations, and updating spreadsheets that consumes security team time better spent on risk reduction activities.
Key dashboard components include current risk exposure in dollars, trend lines showing risk reduction over time, investment analysis comparing security spending to risk mitigation achieved, and scenario modeling that projects outcomes of proposed investments.
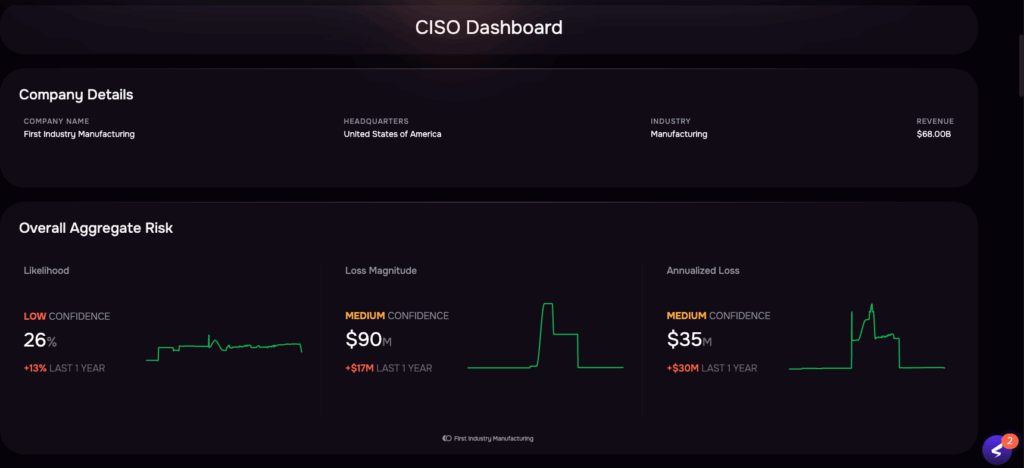
CISO Dashboard, SAFE One
Learn more: Dashboards and Reporting on SAFE One
Driving Risk Reduction And Business Value
Measuring cybersecurity ROI transforms security from a compliance checkbox into a strategic business capability that enables growth, optimizes spending, and demonstrates value to stakeholders. Organizations that quantify risk in financial terms make better investment decisions, prioritize initiatives based on actual risk reduction rather than vendor hype or compliance pressure, and communicate security value in language that resonates with executives and boards.
The key lies in adopting structured frameworks like FAIR that provide defensible methodology, integrating continuous data sources that reflect current conditions, and translating technical metrics into business outcomes that matter to decision-makers. While challenges remain—the counterfactual problem, attribution complexity, data limitations—organizations that acknowledge uncertainty while still providing data-driven estimates earn far more credibility than those relying on fear-based arguments.
SAFE’s platform addresses these challenges by automatically aggregating data from over 100 security tools, calculating control effectiveness using FAIR-based models, and continuously quantifying cyber risk in dollars and cents. The platform’s Agentic AI autonomously performs risk analysis tasks, enabling organizations to scale their risk quantification programs without adding headcount. Security leaders using SAFE can demonstrate defensible ROI to boards, optimize investments based on expected risk reduction, and prove that cybersecurity delivers measurable business value.
Watch a Video Introduction: See SAFE in Action
Request a demo to see how SAFE transforms cybersecurity into a strategic business accelerator through autonomous cyber risk quantification.
Frequently Asked Questions About Cybersecurity ROI
>>Which ROI formula works best for organizations with limited security maturity?
Organizations early in their security journey benefit from simple Annualized Loss Exposure (ALE) calculations that require minimal data and provide directional guidance for prioritizing investments. As maturity increases, they can adopt more sophisticated FAIR-based models that account for probability distributions and control effectiveness.
>>When should companies use a cybersecurity ROI calculator versus manual analysis?
Automated ROI calculators deliver the most value when organizations manage complex environments with hundreds of security tools, need continuous risk visibility rather than point-in-time assessments, or lack dedicated resources for manual risk quantification. Manual analysis remains appropriate for one-time strategic investment decisions or small organizations with simple security stacks.
>>How does cyber insurance factor into security ROI calculations?
Cyber insurance premiums reflect insurers’ assessment of your risk profile, so improved security posture reduces premium costs—a direct, measurable ROI component. Insurance also transfers residual risk, effectively capping maximum loss exposure, which changes the risk reduction value of additional security investments once adequate coverage is in place.
Schedule your demo of the SAFE One cyber risk management platform now.