Understanding “Secondary Loss”, the Price of a Data Breach
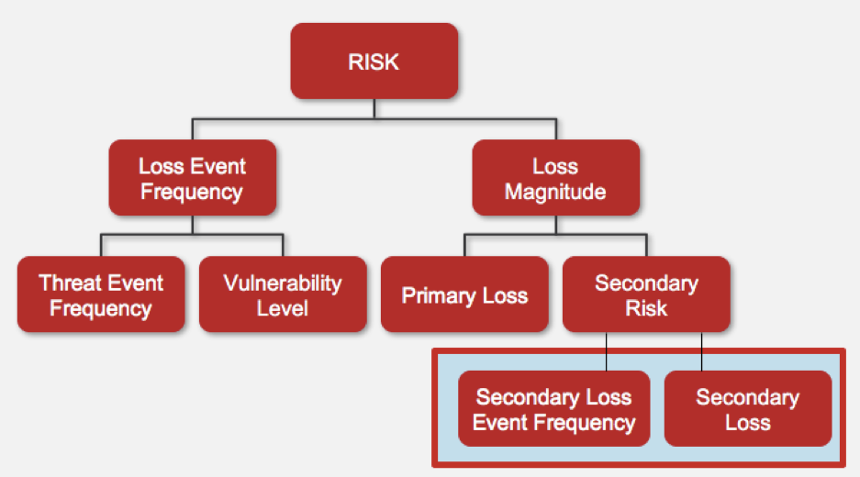
We’re big fans of the FAIR model that powers the RiskLens platform because it’s a tool for running down every little corner of potential threats and losses to arrive at as accurate an estimate of risk as possible. It’s also a model of clear thinking – you can pretty much look at this diagram below and understand how we analyze risk.
But even we will admit that there’s one little corner of the model – “Secondary Risk” and its components “Secondary Loss” and “Secondary Loss Event Frequency” — down there at the bottom right – that takes a lot of explaining to clients.

It shouldn’t.
Secondary Loss can run into big numbers – like health insurer Anthem paying out $115 million to settle a lawsuit by victims of the theft of nearly 80 million records in a 2015 data breach. Secondary Loss, in other words, is not second place.
What Is Secondary Risk?
Definition: Primary stakeholder loss-exposure that exists due to the potential for secondary stakeholder reactions to the primary event.
Secondary risk comes down to the percent of time you can expect to see the secondary loss materialize. The model breaks it out into a secondary loss event frequency so we can allow for the loss to happen at different frequencies based on the type of the event (we will get into that in a minute).
What Does Secondary Loss Cover?
What percent of the time do you anticipate a cost caused by a secondary stakeholder?
What losses, in terms of dollars and cents, could you experience from a secondary stakeholder?
When thinking through the forms of loss we will most likely see Secondary Response Cost (for instance, customer communications), Fines and Judgements, Reputation Loss, and Competitive Advantage Loss.
Some examples we will typically see when performing analyses include the following:
- Civil, criminal, or contractual fines and judgements
- Notification costs
- Credit monitoring
- Covering secondary stakeholder monetary loss
- Public relations costs
- Legal defense costs
- The effects of regulatory sanctions
- Lost market share
- Diminished stock price
- Increased cost of capital
What Are Some Examples of Secondary Loss?
One of the most common examples that comes to mind when thinking of secondary risk is a data breach of customer data, whether it be personally identifiable information (PII), customer sensitive data, credit card numbers or HIPPA information.
Most of the time, you will see all customers affected, which means your secondary loss event frequency data points will be relatively high. Additionally, your organization will spend time responding to customers, there’s a potential you may need to pay for credit card monitoring, pay fines and judgements, and it may even cause some reputation damage depending on how bad the event is.
On the other hand, say your organization experiences an outage of an internal system, the secondary loss event frequency is going to be very low, if it even shows up at all.
Now think of an instance where your organization experiences an outage of an external facing sales system, maybe a system that provides most of your business if you are in retail. This could have major effects on your sales if it occurs during peak selling hours. If you were to experience the same outage during off hours your customers may not even notice the outage.
There are many different factors that come into play when it comes to your customers experiencing the fallout from a scenario.
What Does Secondary Loss Look Like for Your Organization?
The beauty of the FAIR model is that is allows for flexibility, a good thing since there so many different scenarios in analyzing risk. The Secondary Risk node, in particular, lets us identify and feed in to the model a wide range of consequences specific to your business that might arise from a damaging cyber or operational event.
To fill in the dollar amounts, we draw on a range of public information (for instance, on fines and judgements), on industry information we’ve collected, and on your internal data (for instance, costs to run a customer outreach campaign) to give you a clear –and detailed—picture of risk as it might affect all corners of your business.


