Annualized Loss Exposure (ALE), sometimes referred to as annualized loss expectancy, is the most recognized and relevant figure businesses can pull from quantitative analysis. As such, the RiskLens platform places a strong emphasis on making this information clear to inform good decision making. This post will help clarify for our customers (and those interested in the FAIR model) what ALE is and what it isn’t.
What It Is
Annualized Loss Exposure is the key metric in the simplest form of how we communicate risk. Essentially, it’s the potential loss a company faces each time it makes a decision to spend money, which could be anything from buying new hardware to enforcing certain processes within the organization.
Let’s dive deeper here — What we call Loss Exposure is the result we get when multiplying the probable frequency of a risk event by the cost (or magnitude) of said risk coming into fruition. Annualized Loss Exposure is based on this model, and expresses those figures on a yearly basis.
Examples:
- 6 events per year x $10,000 per event loss equals an ALE of $60,000
- 1 event every 4 years x $800,000 per event equals an ALE of $200,000
Note that in scenario 2, when a single loss event occurs, the organization would lose $800,000. However, the ALE is $200,000 because it is only likely to occur once every 4 years; ALE is an annualized value, and expresses loss as an annual rate.
ALE is useful in many ways. It allows us to prioritize or compare separate risk issues, which often have different frequencies and per-event impacts. It allows us to identify the impact of potential risks and decide what risk management strategies should be implemented to avoid financial loss. Furthermore, it puts a clear, monetary value on the vulnerability of every asset. To learn more about how the RiskLens platform calculates and displays this information, check out our blog post about RiskLens reporting.
What Annualized Loss Exposure Is Not
Annualized Loss Exposure is not a prediction. The reason we prefer “Annualized Loss Exposure” over “Annualized Loss Expectancy” is because FAIR is a probabilistic approach. People often hear “expectancy” and misinterpret the data as, “I am going to lose X amount of dollars per year.” This isn’t necessarily correct.
Understanding the probability of something is not the same as prediction (ex. Think rolling dice). ALE is an indicator of what it might cost if something goes wrong, which is useful in determining how to proceed with risk management.
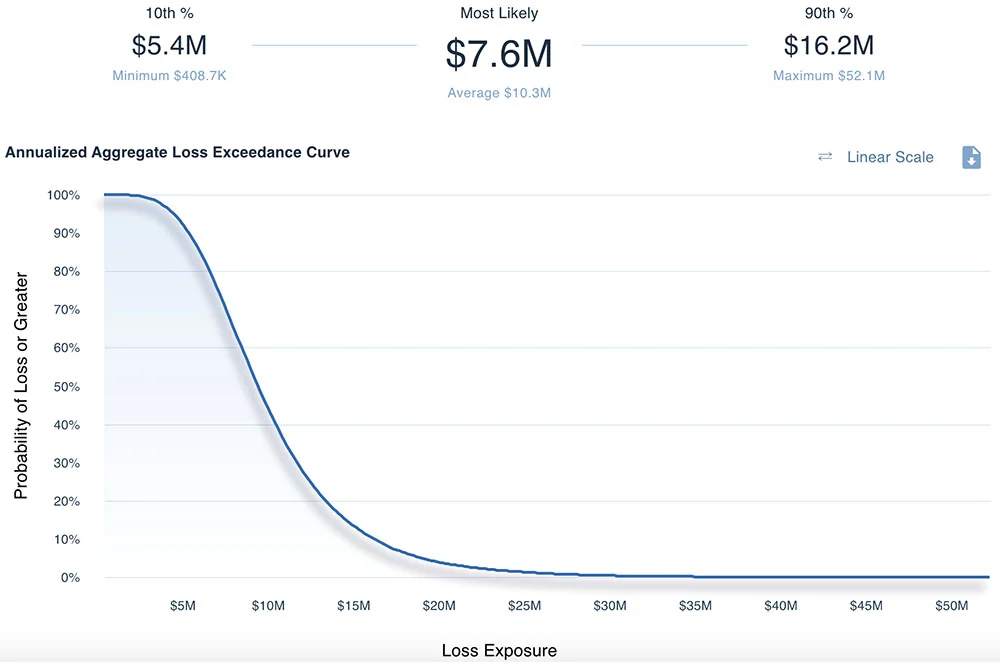
Another important thing to know about ALE is that it is not a single number. Monte Carlo simulations are one of the core methods applied when running a FAIR analysis. The result from these simulations is a result set that has a minimum, maximum, and thousands of results between. We can use that result set to compute Most Likely, 10th percentile and 90th percentiles, etc. How do we represent this within the RiskLens platform? See below:

Applications
In summary, Annualized Loss Exposure is one of the most important pieces of data you can get from performing a quantitative risk analysis. Once you understand the costs of potential losses and the probability of their occurrence, you can make educated decisions about how much of your budget should be allocated to risk reduction and mitigation and where those strategies are needed most.
Want to learn more about how RiskLens quantifies ALE and uses it to help businesses make informed risk management decisions? Read about how we helped an industrial company quantify the cybersecurity risk posed by their autonomous robots and decide what measures needed to be taken to minimize risk.


